Total Records
2,218
Total Deaths
6,265
Total Injured
8,106
Top District
Dhaka
Project Summary
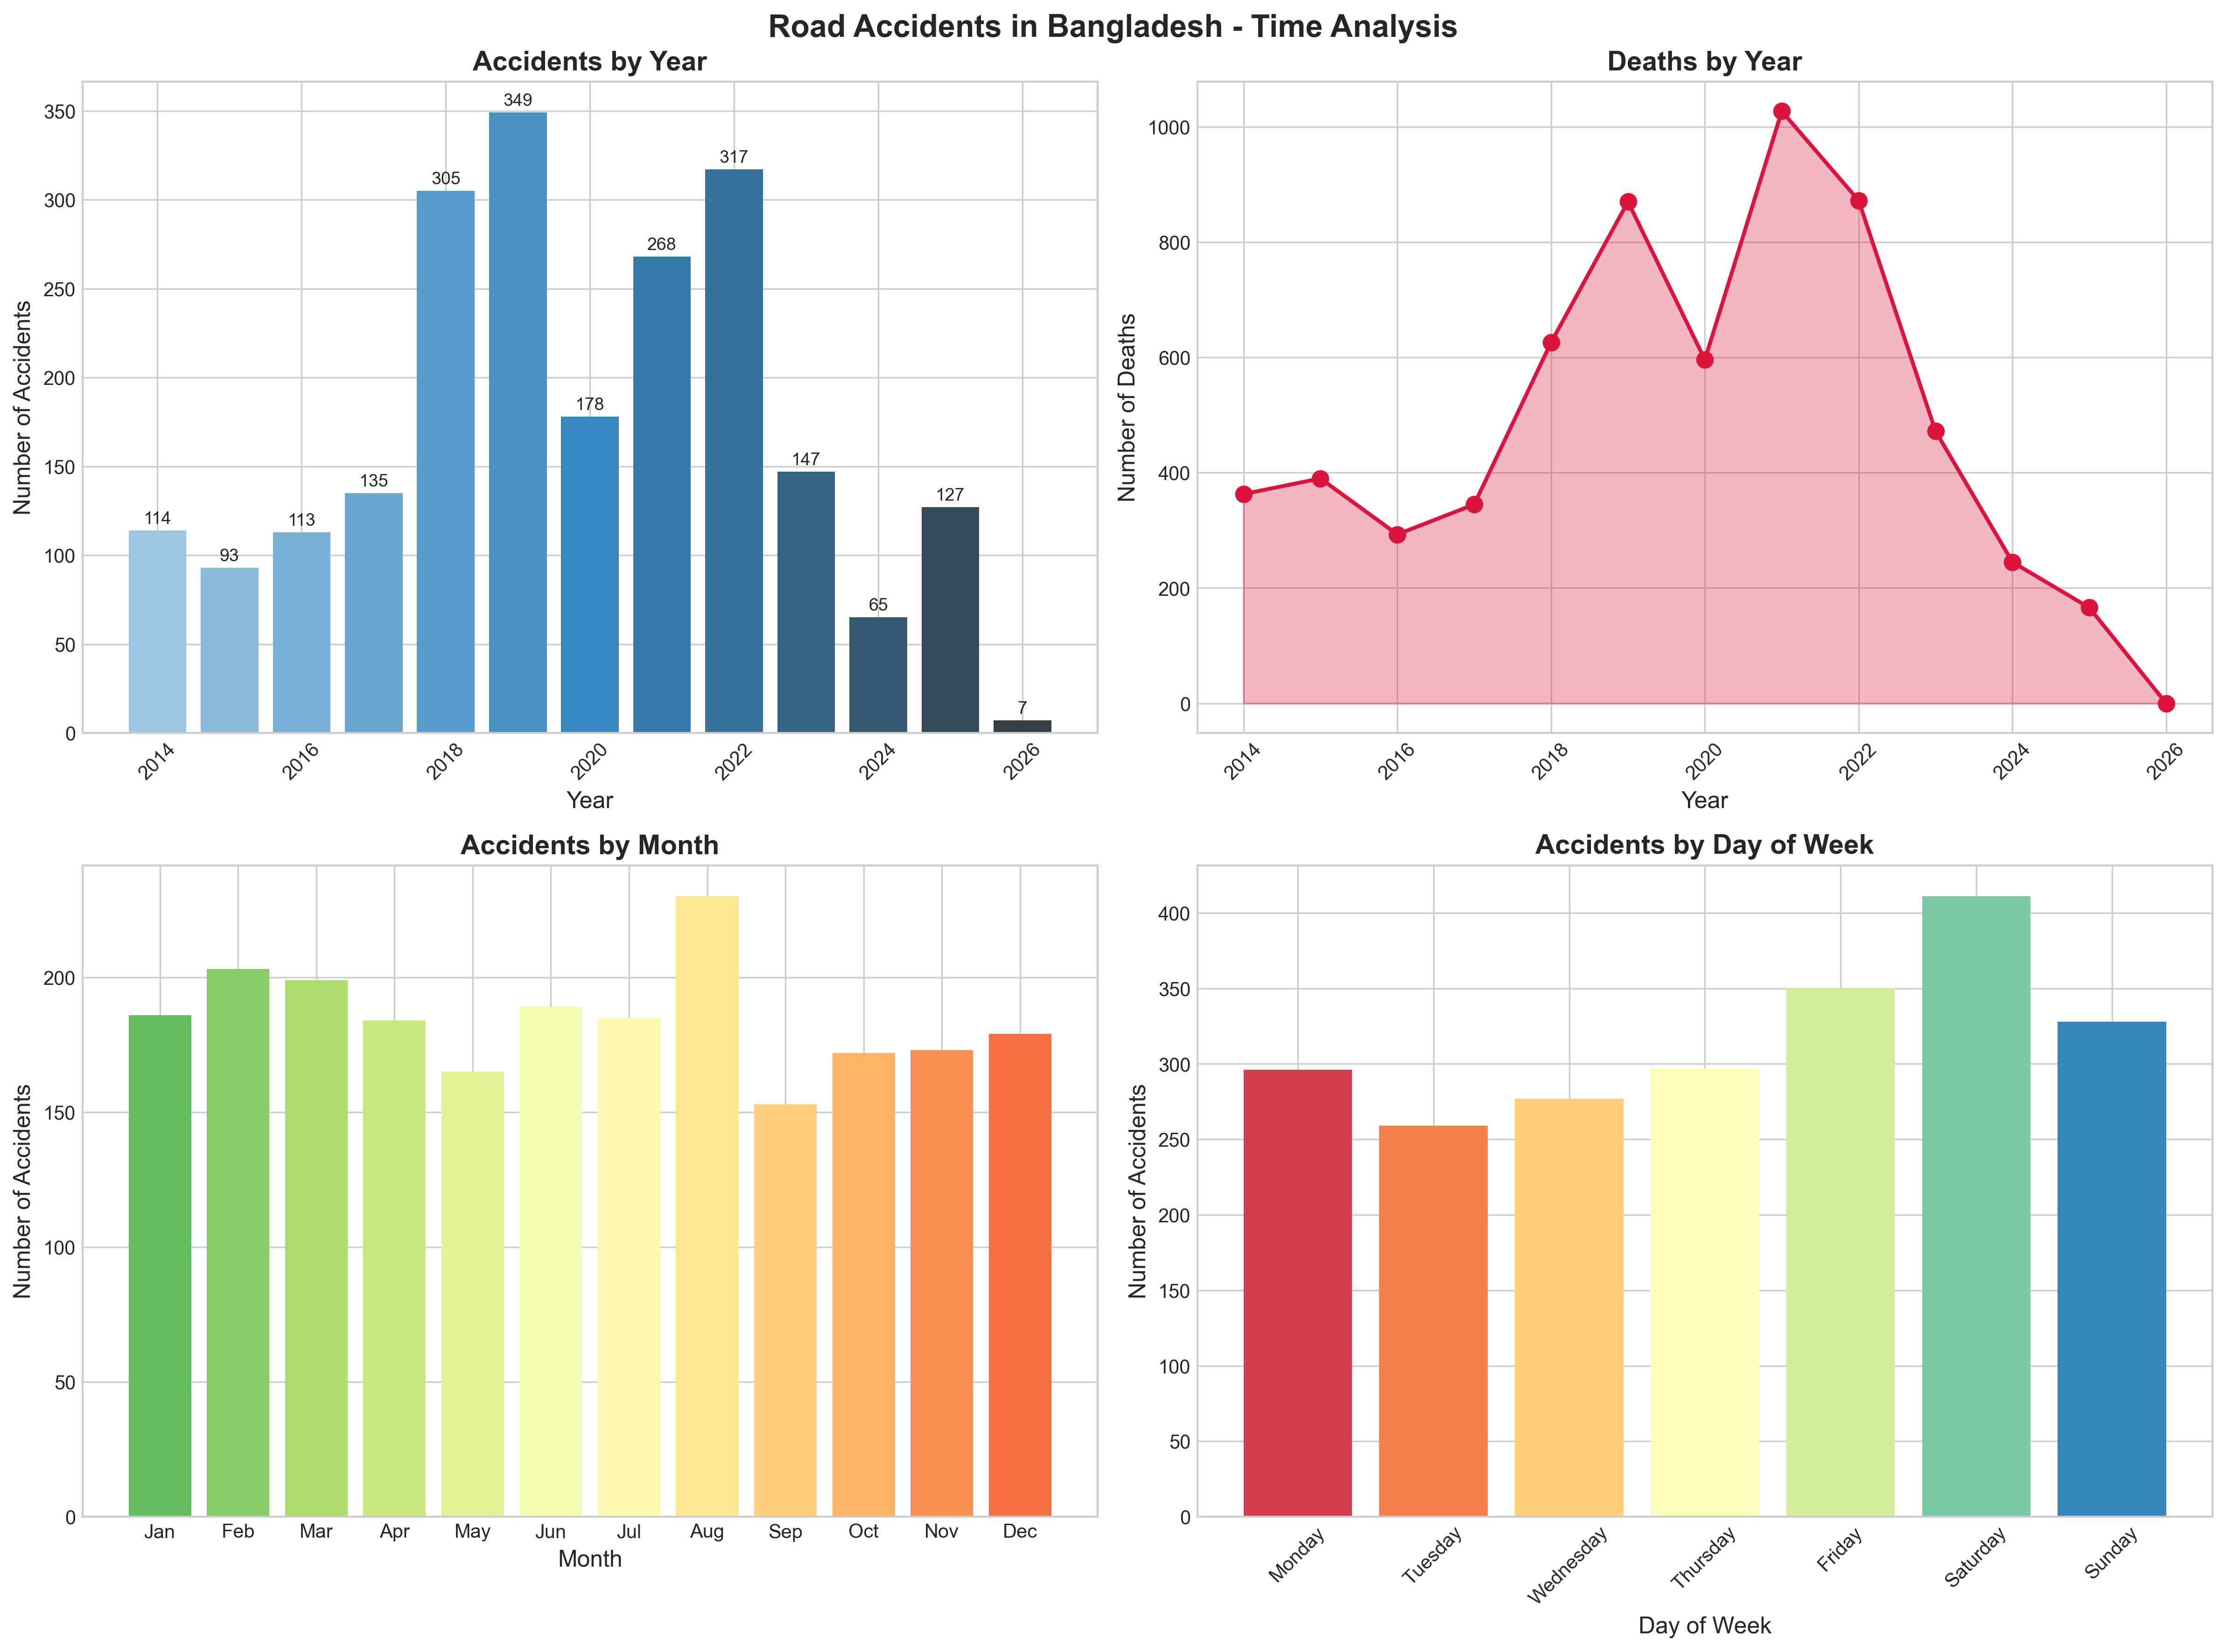
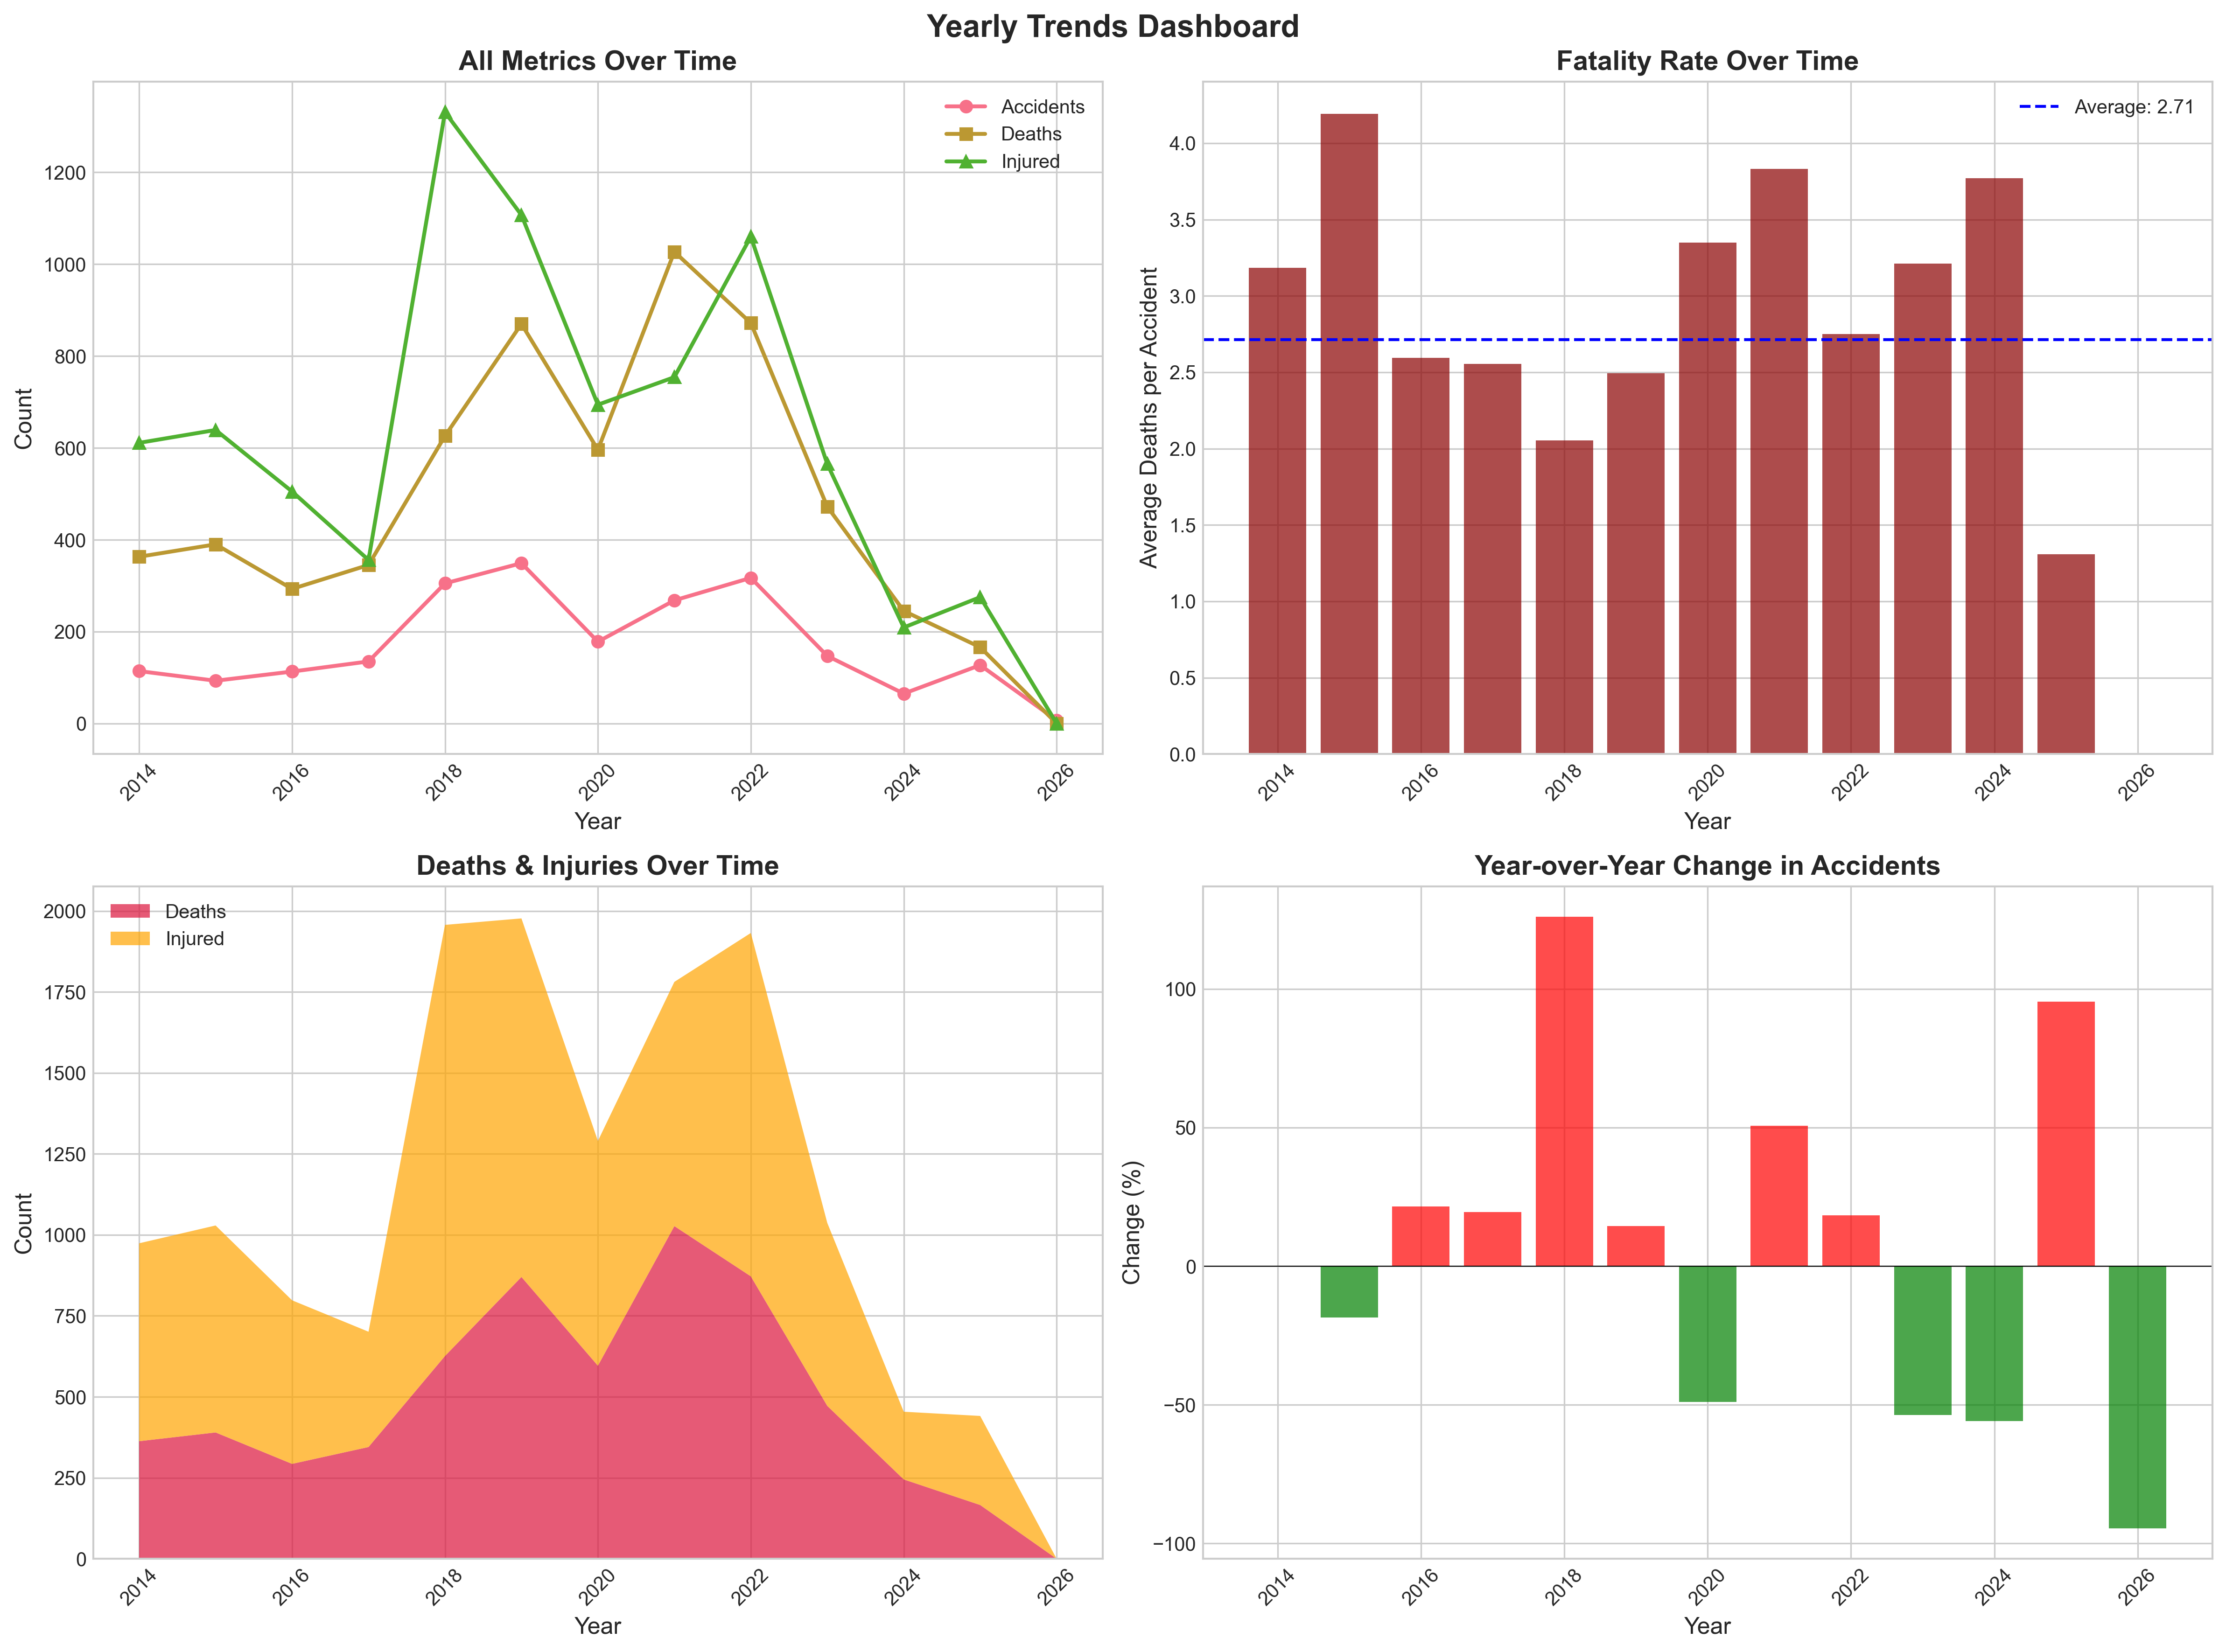
This project provides a critical look into the landscape of road safety in Bangladesh. By analyzing over 2,200 unique accident reports from the last decade, we have identified key risk factors, geographical hotspots, and temporal patterns that contribute to the country's high fatality rate.
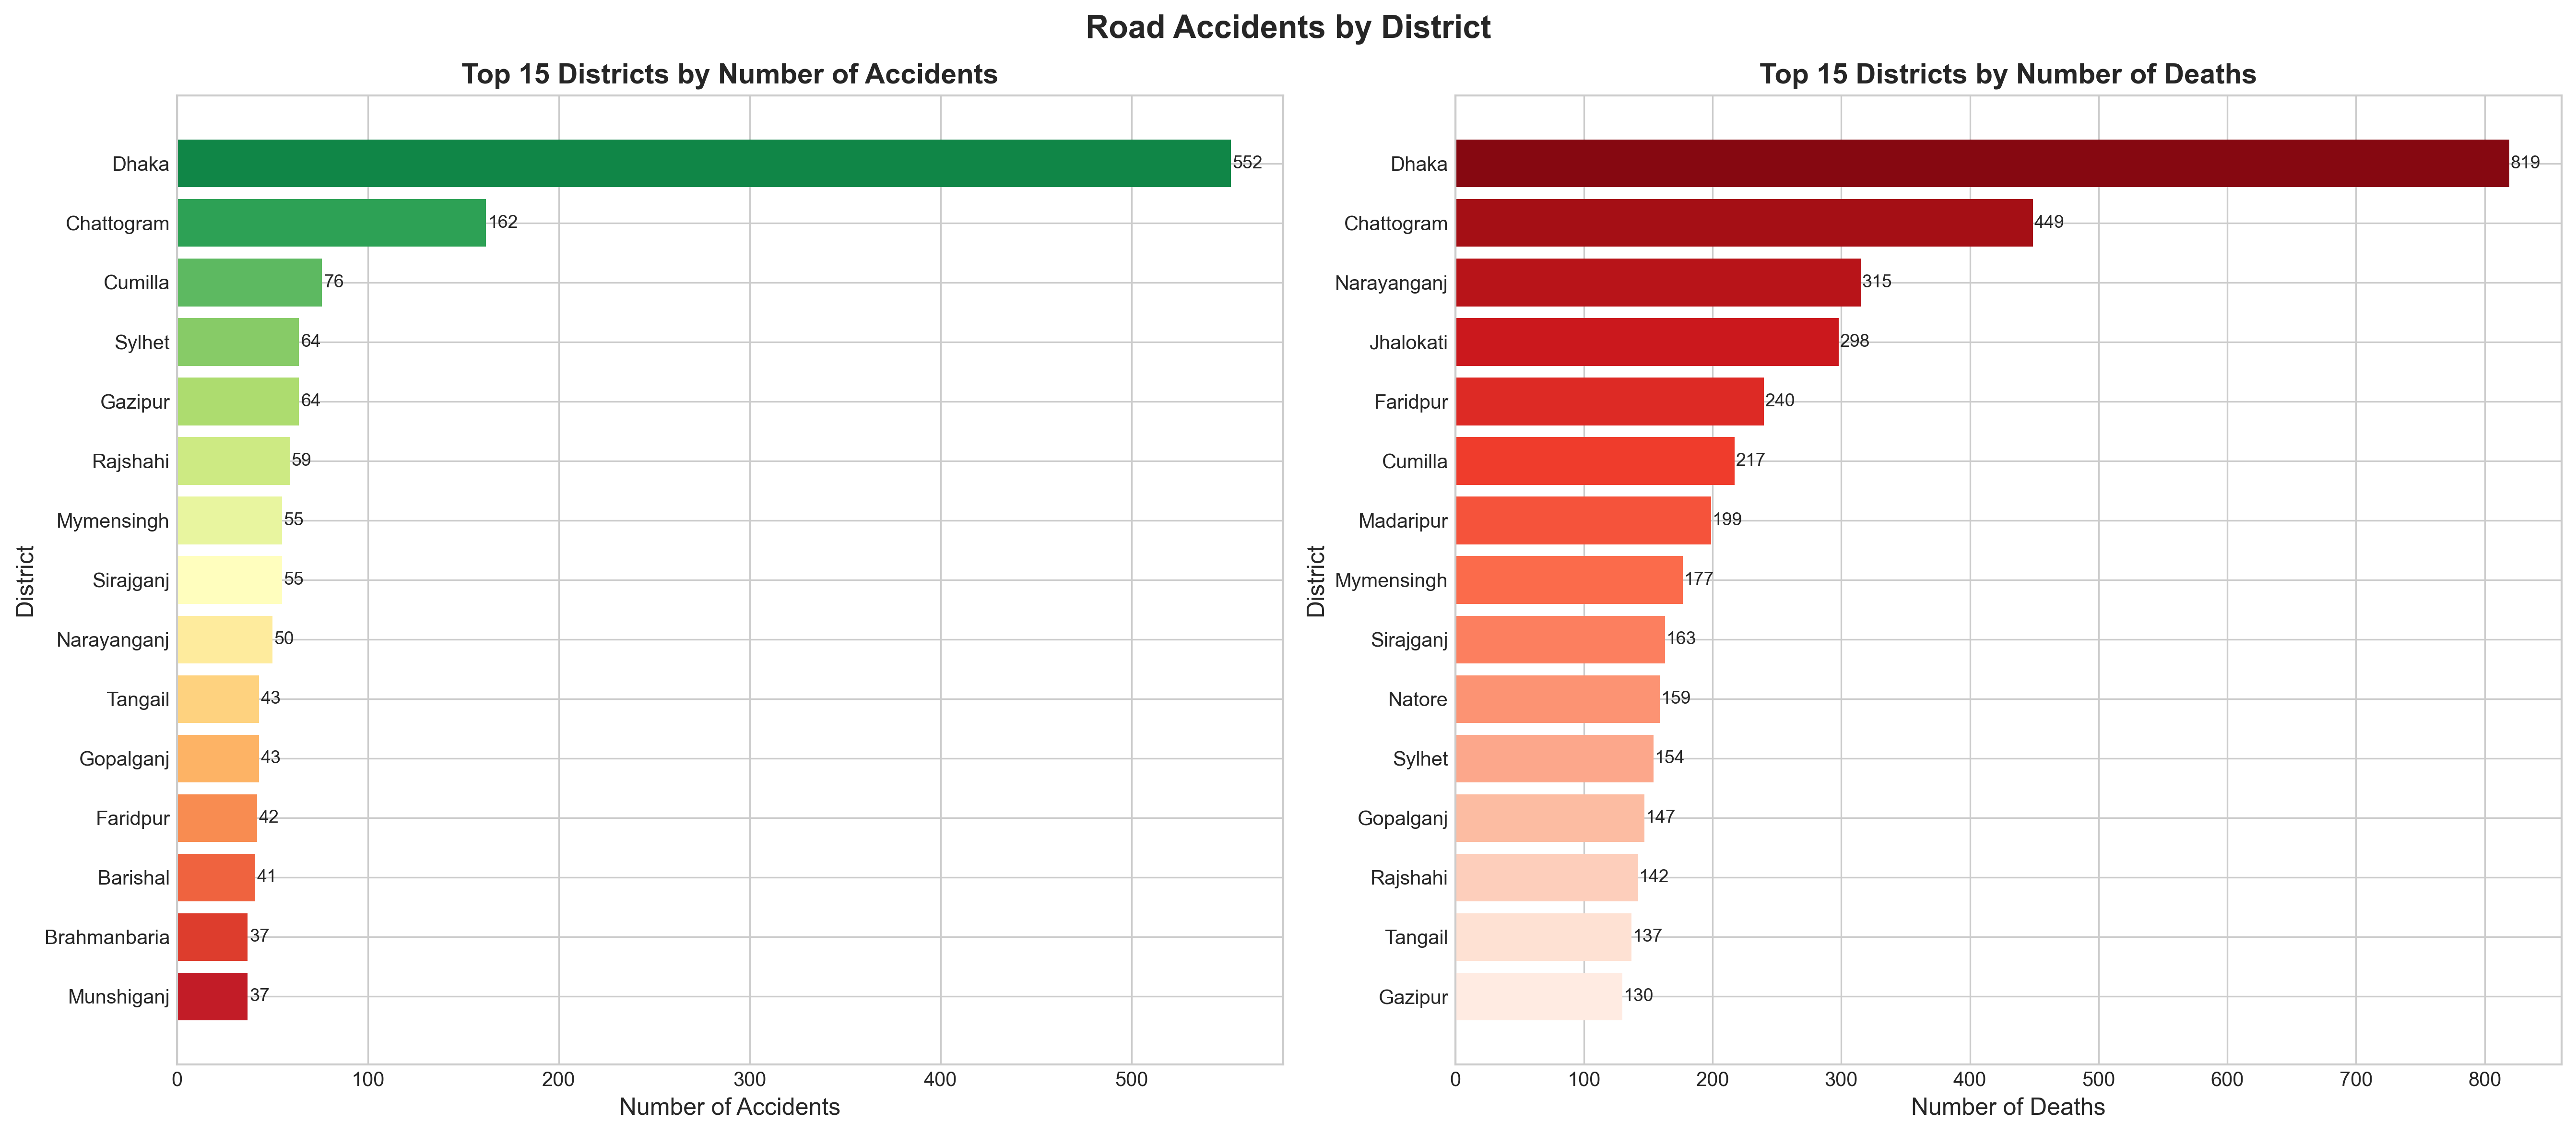
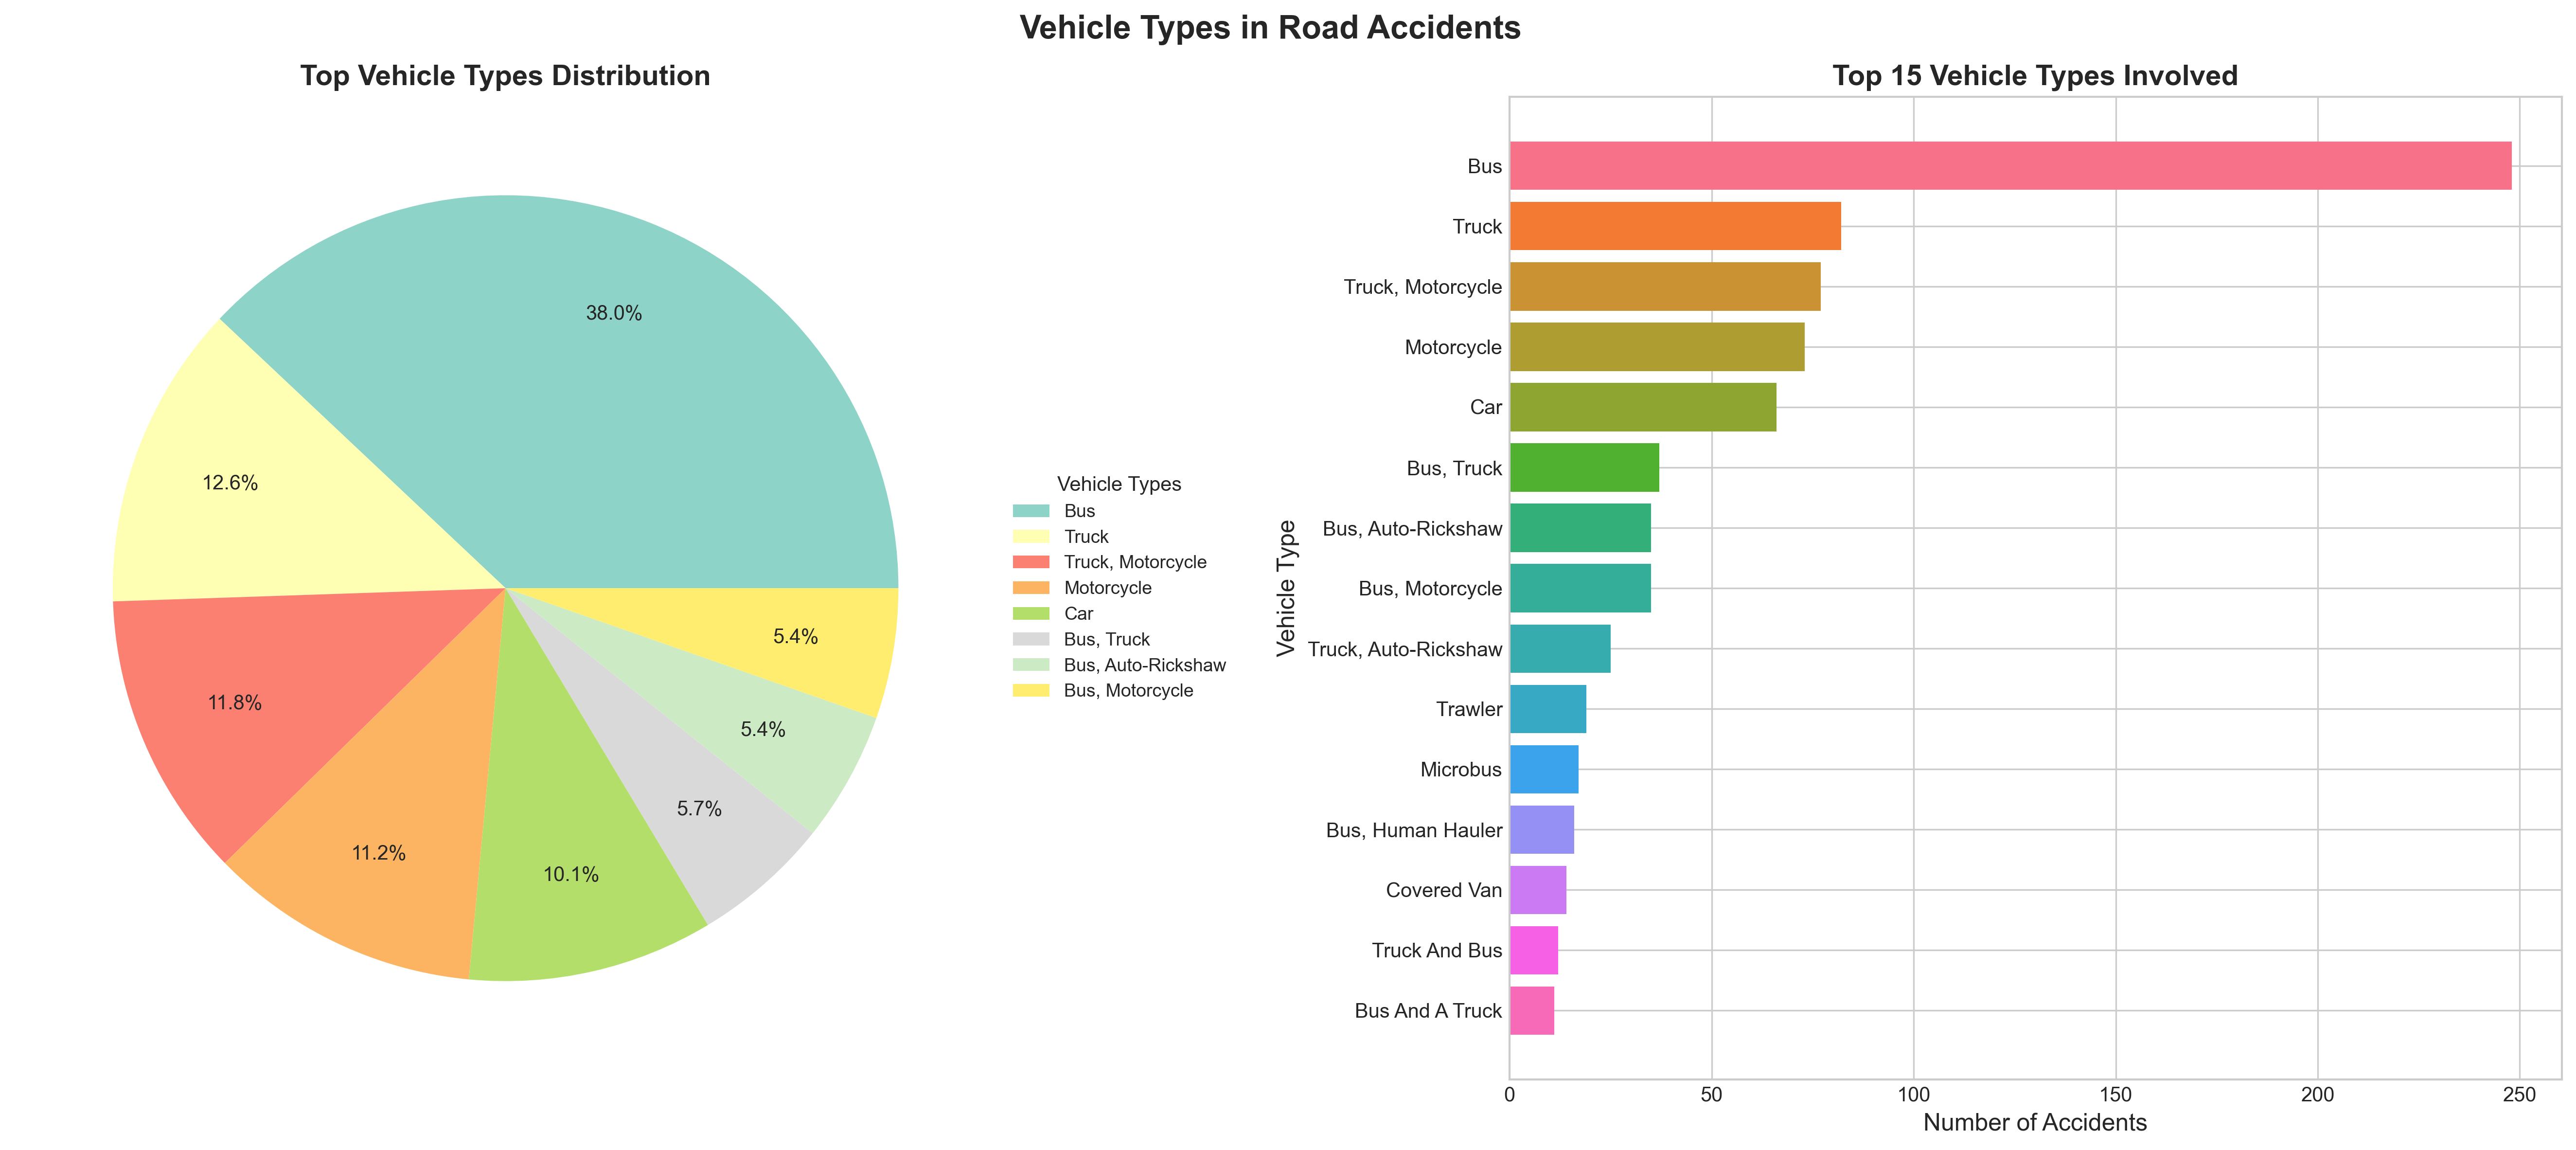
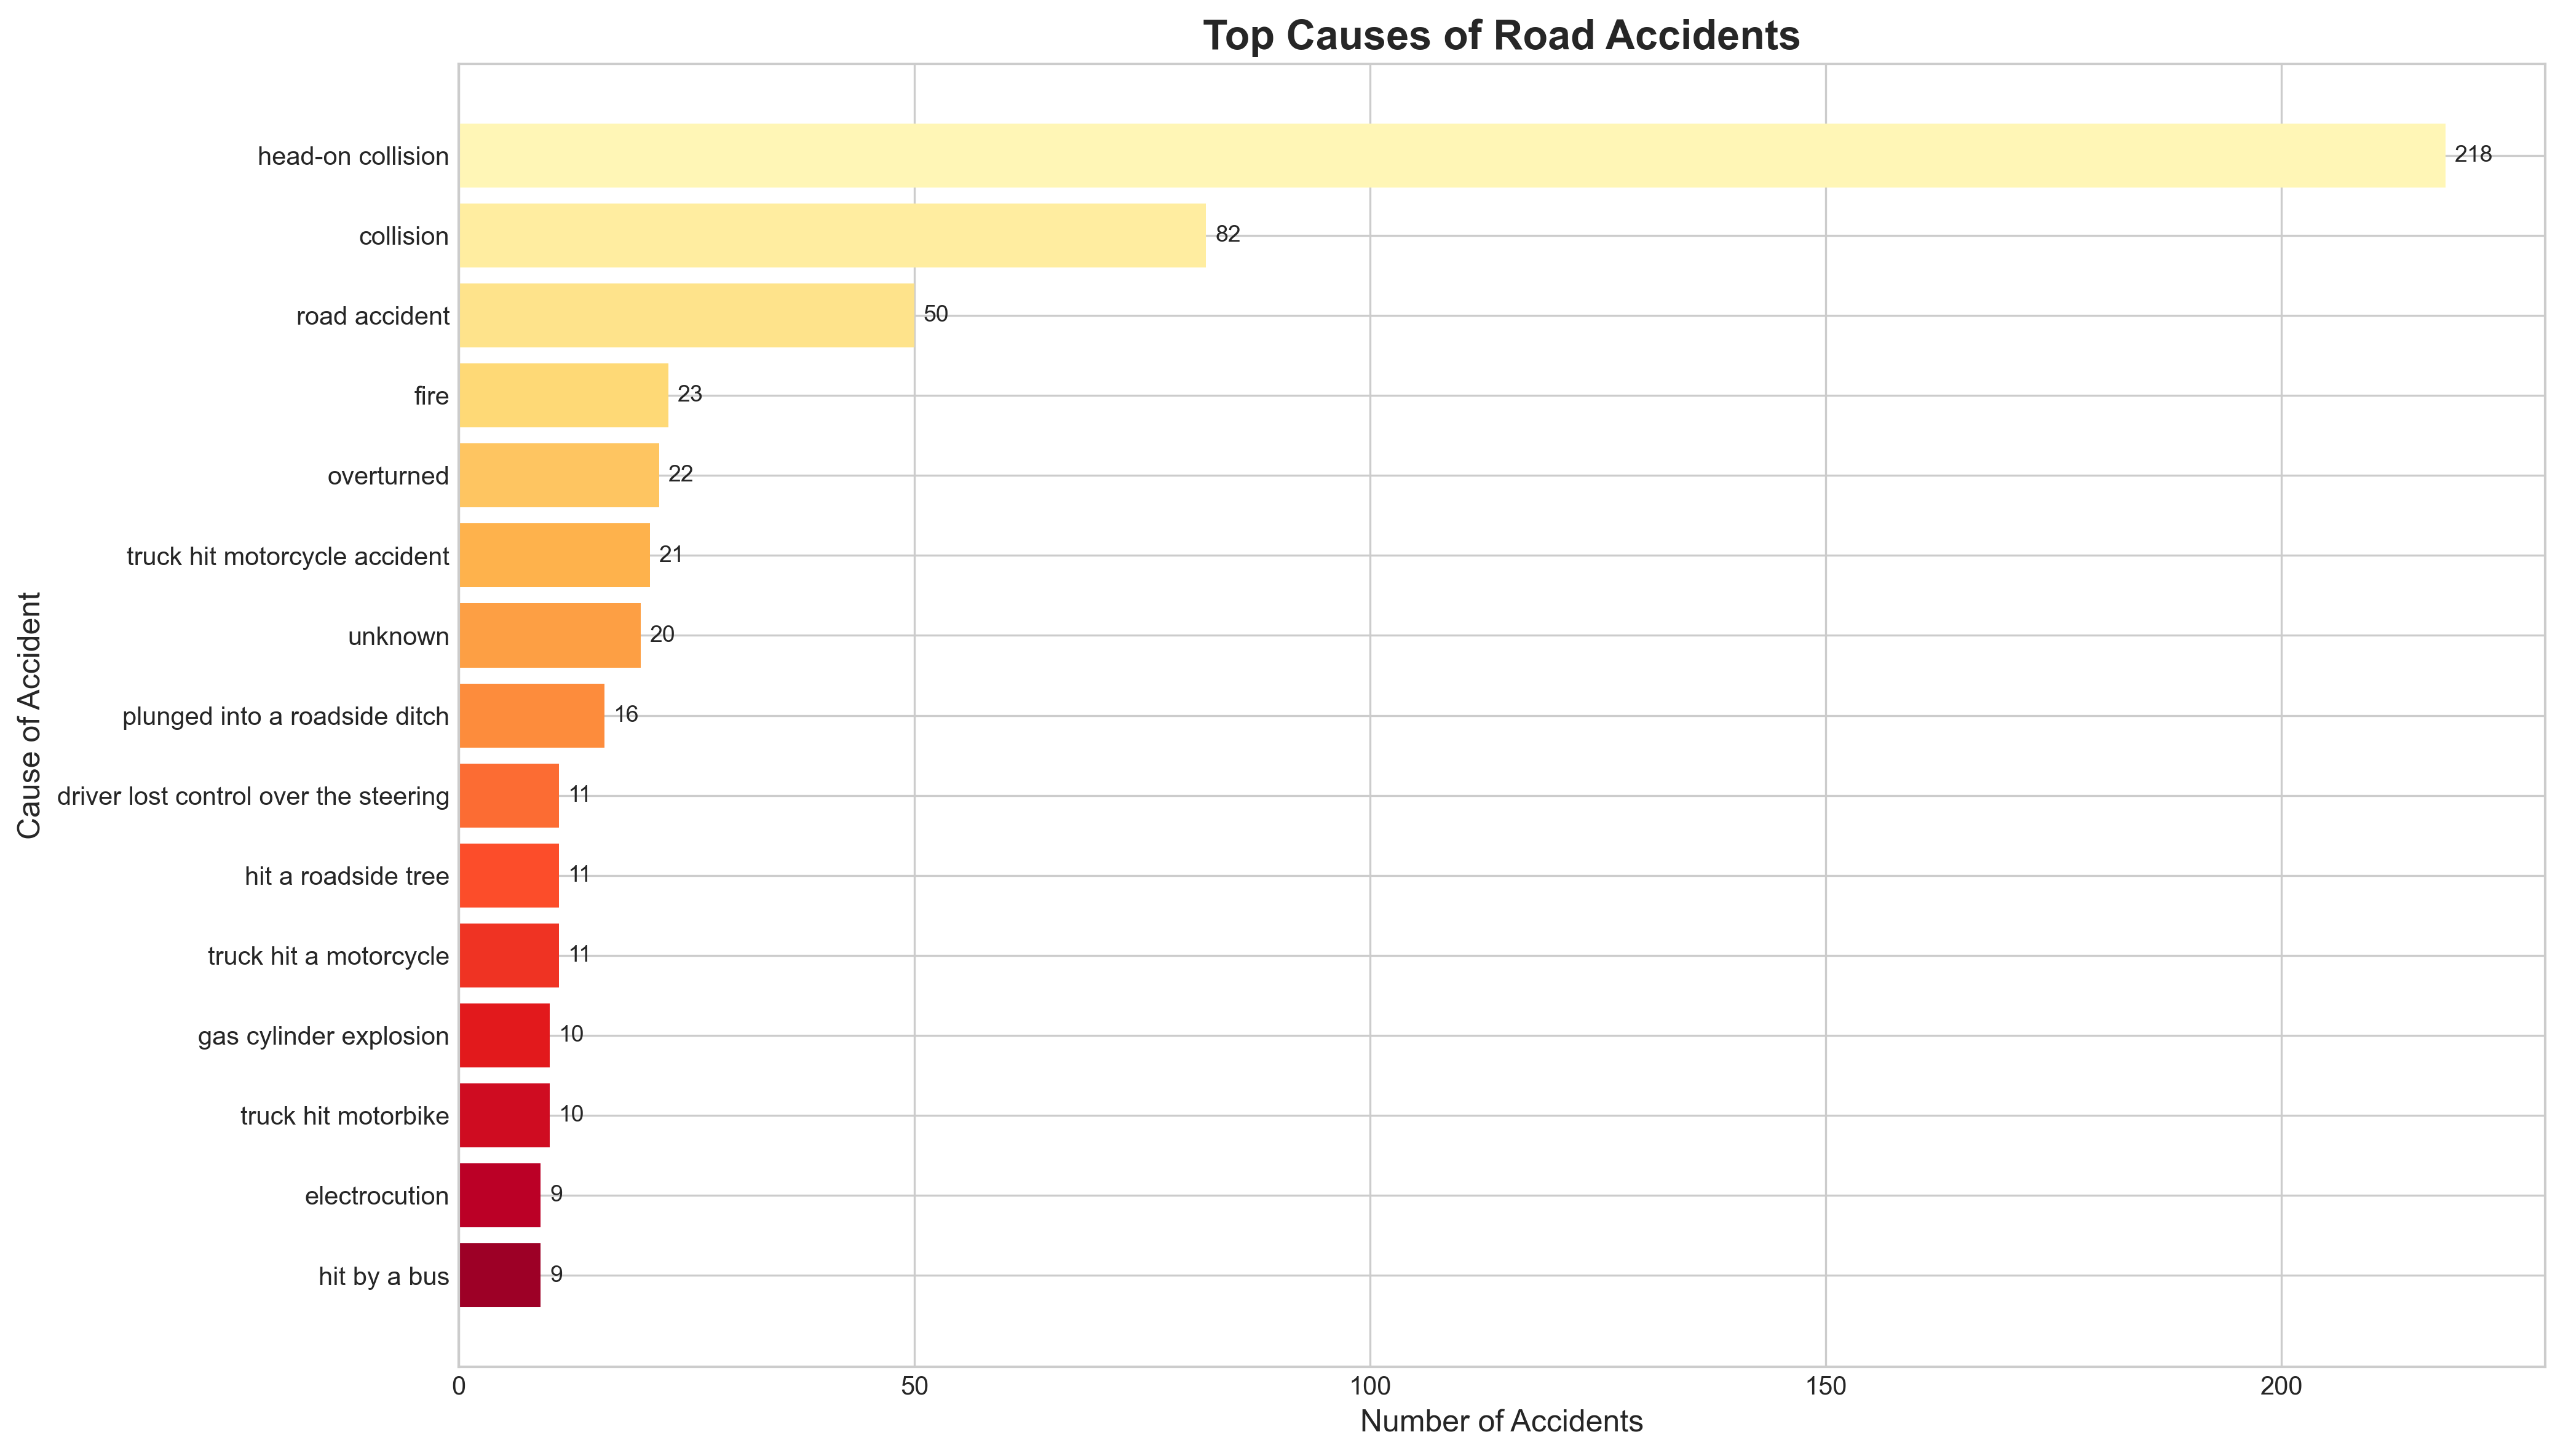
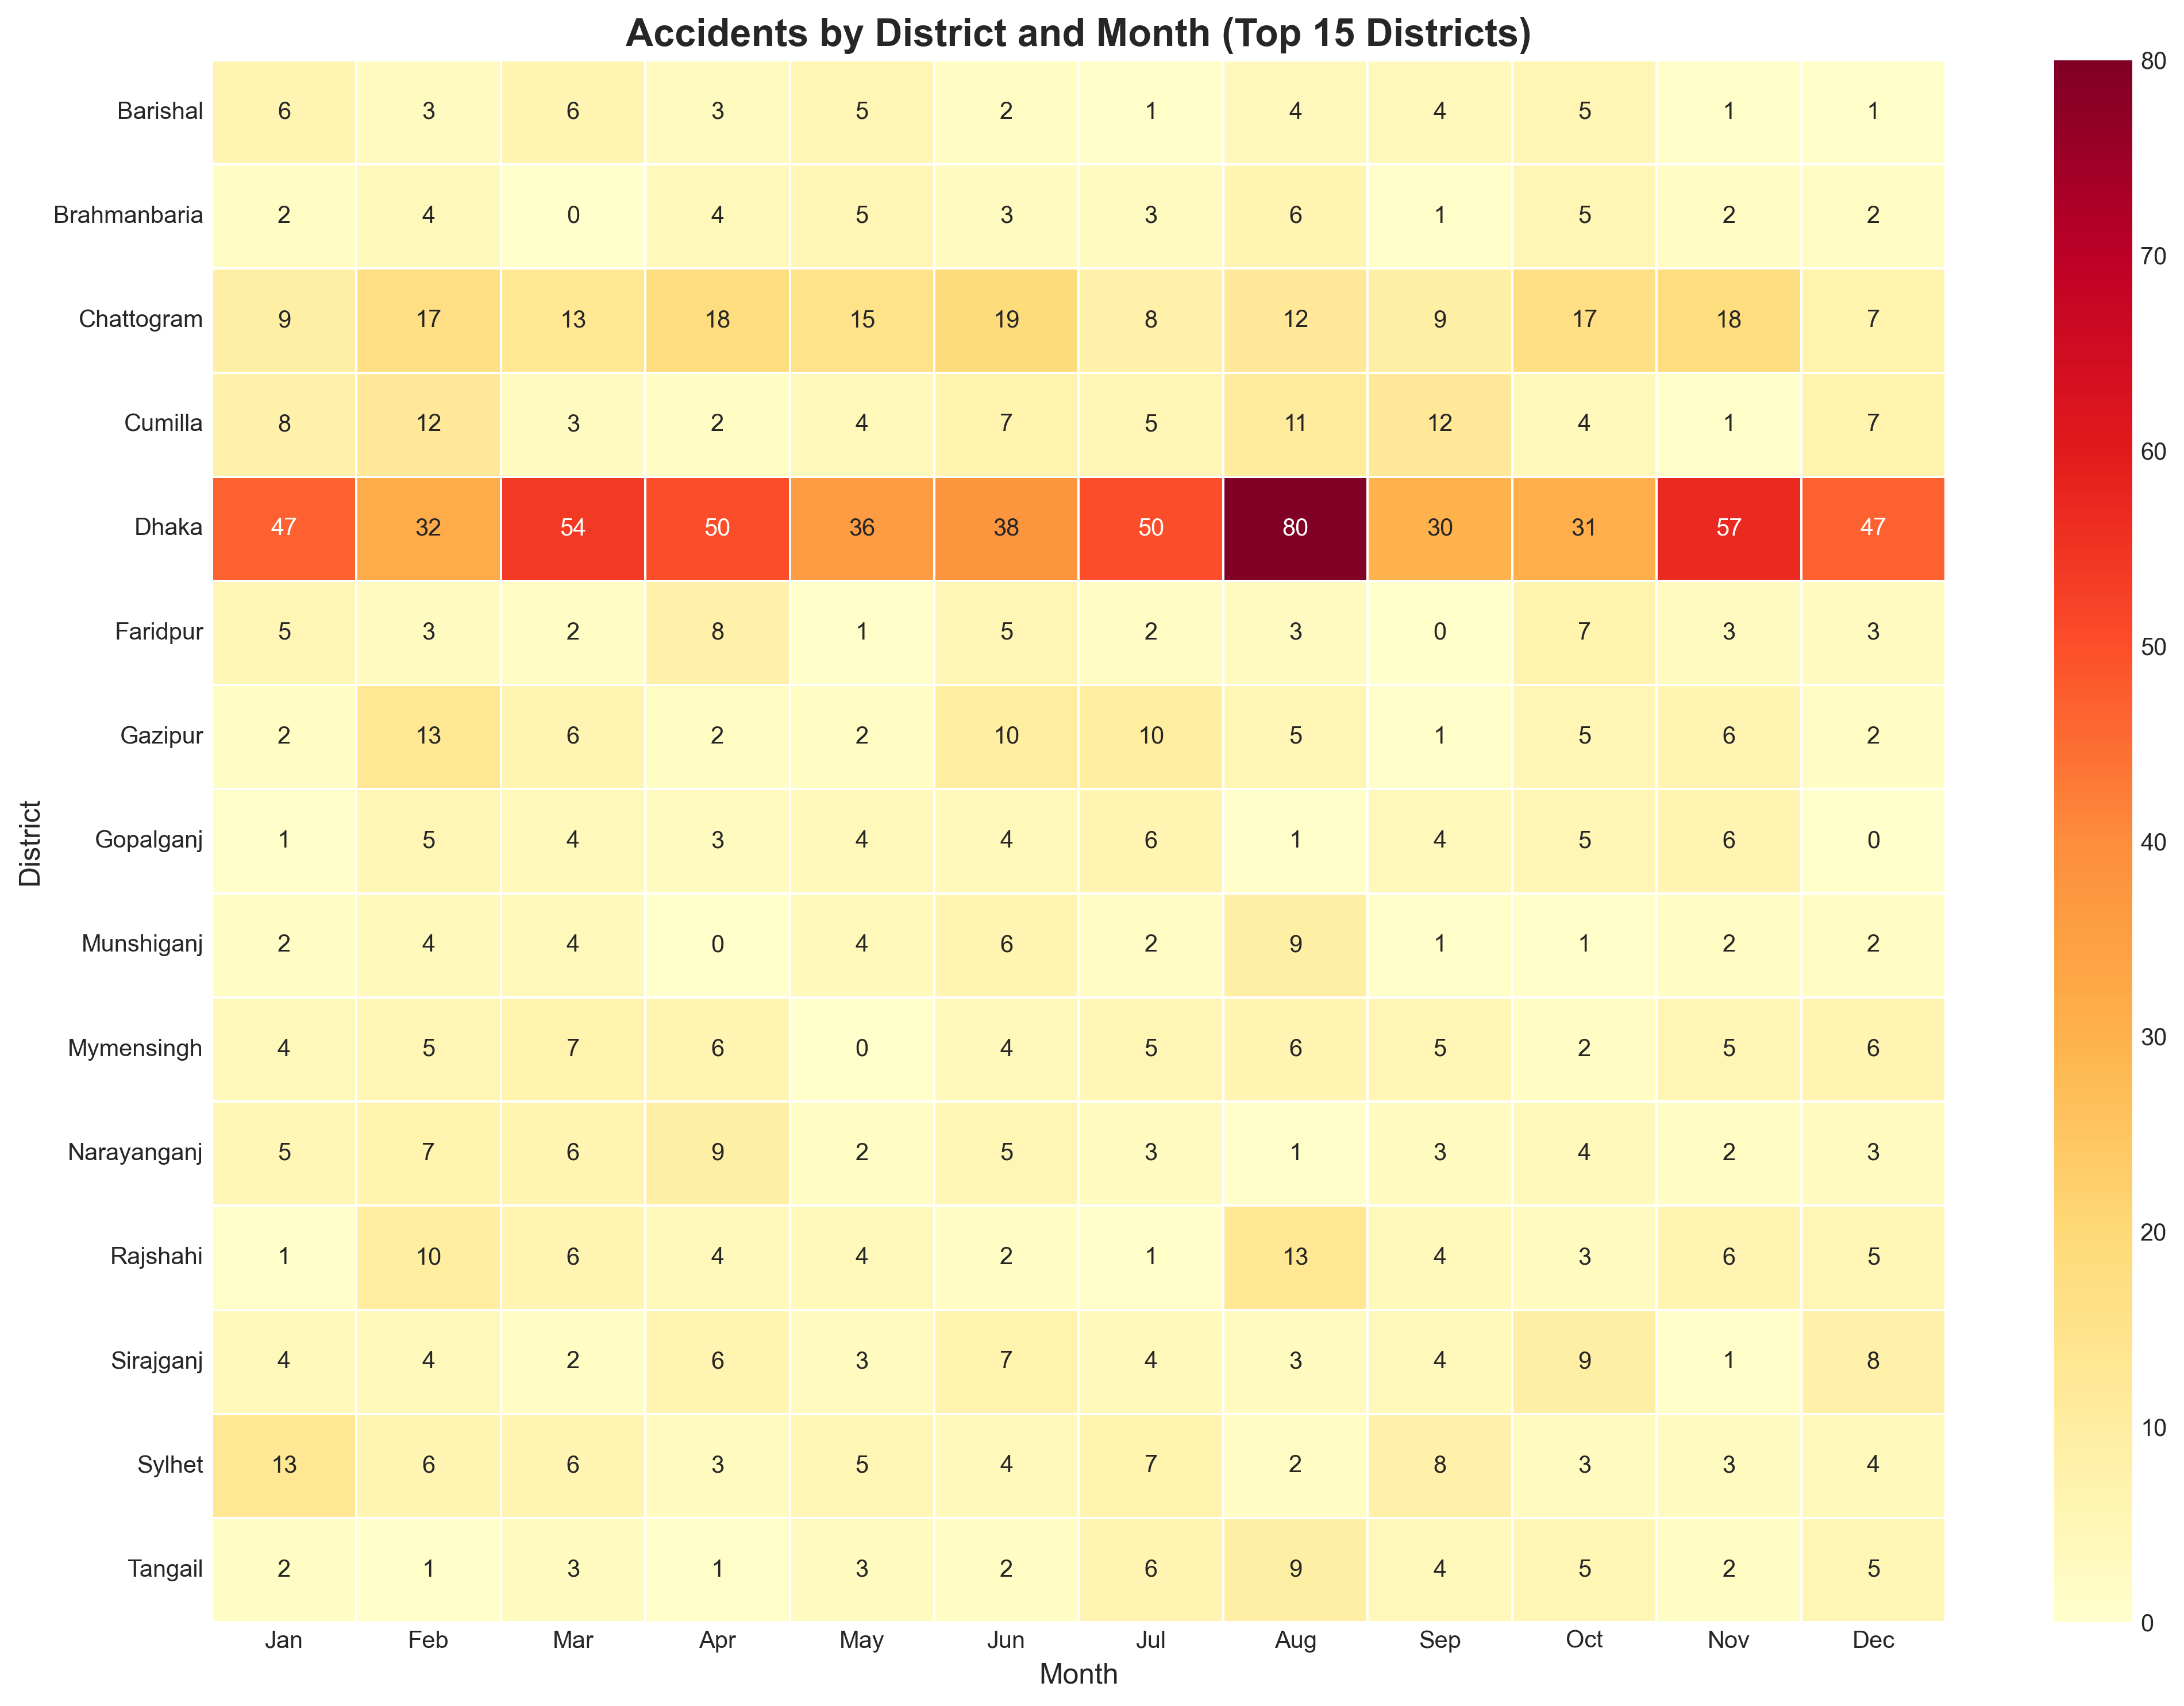
Our findings reveal that while urbanization brings economic growth, it also centralizes accident risks, with Dhaka accounting for a staggering 25% of all reported incidents. The prevalence of head-on collisions and heavy vehicle involvement underscores the urgent need for better traffic management and infrastructure reform.
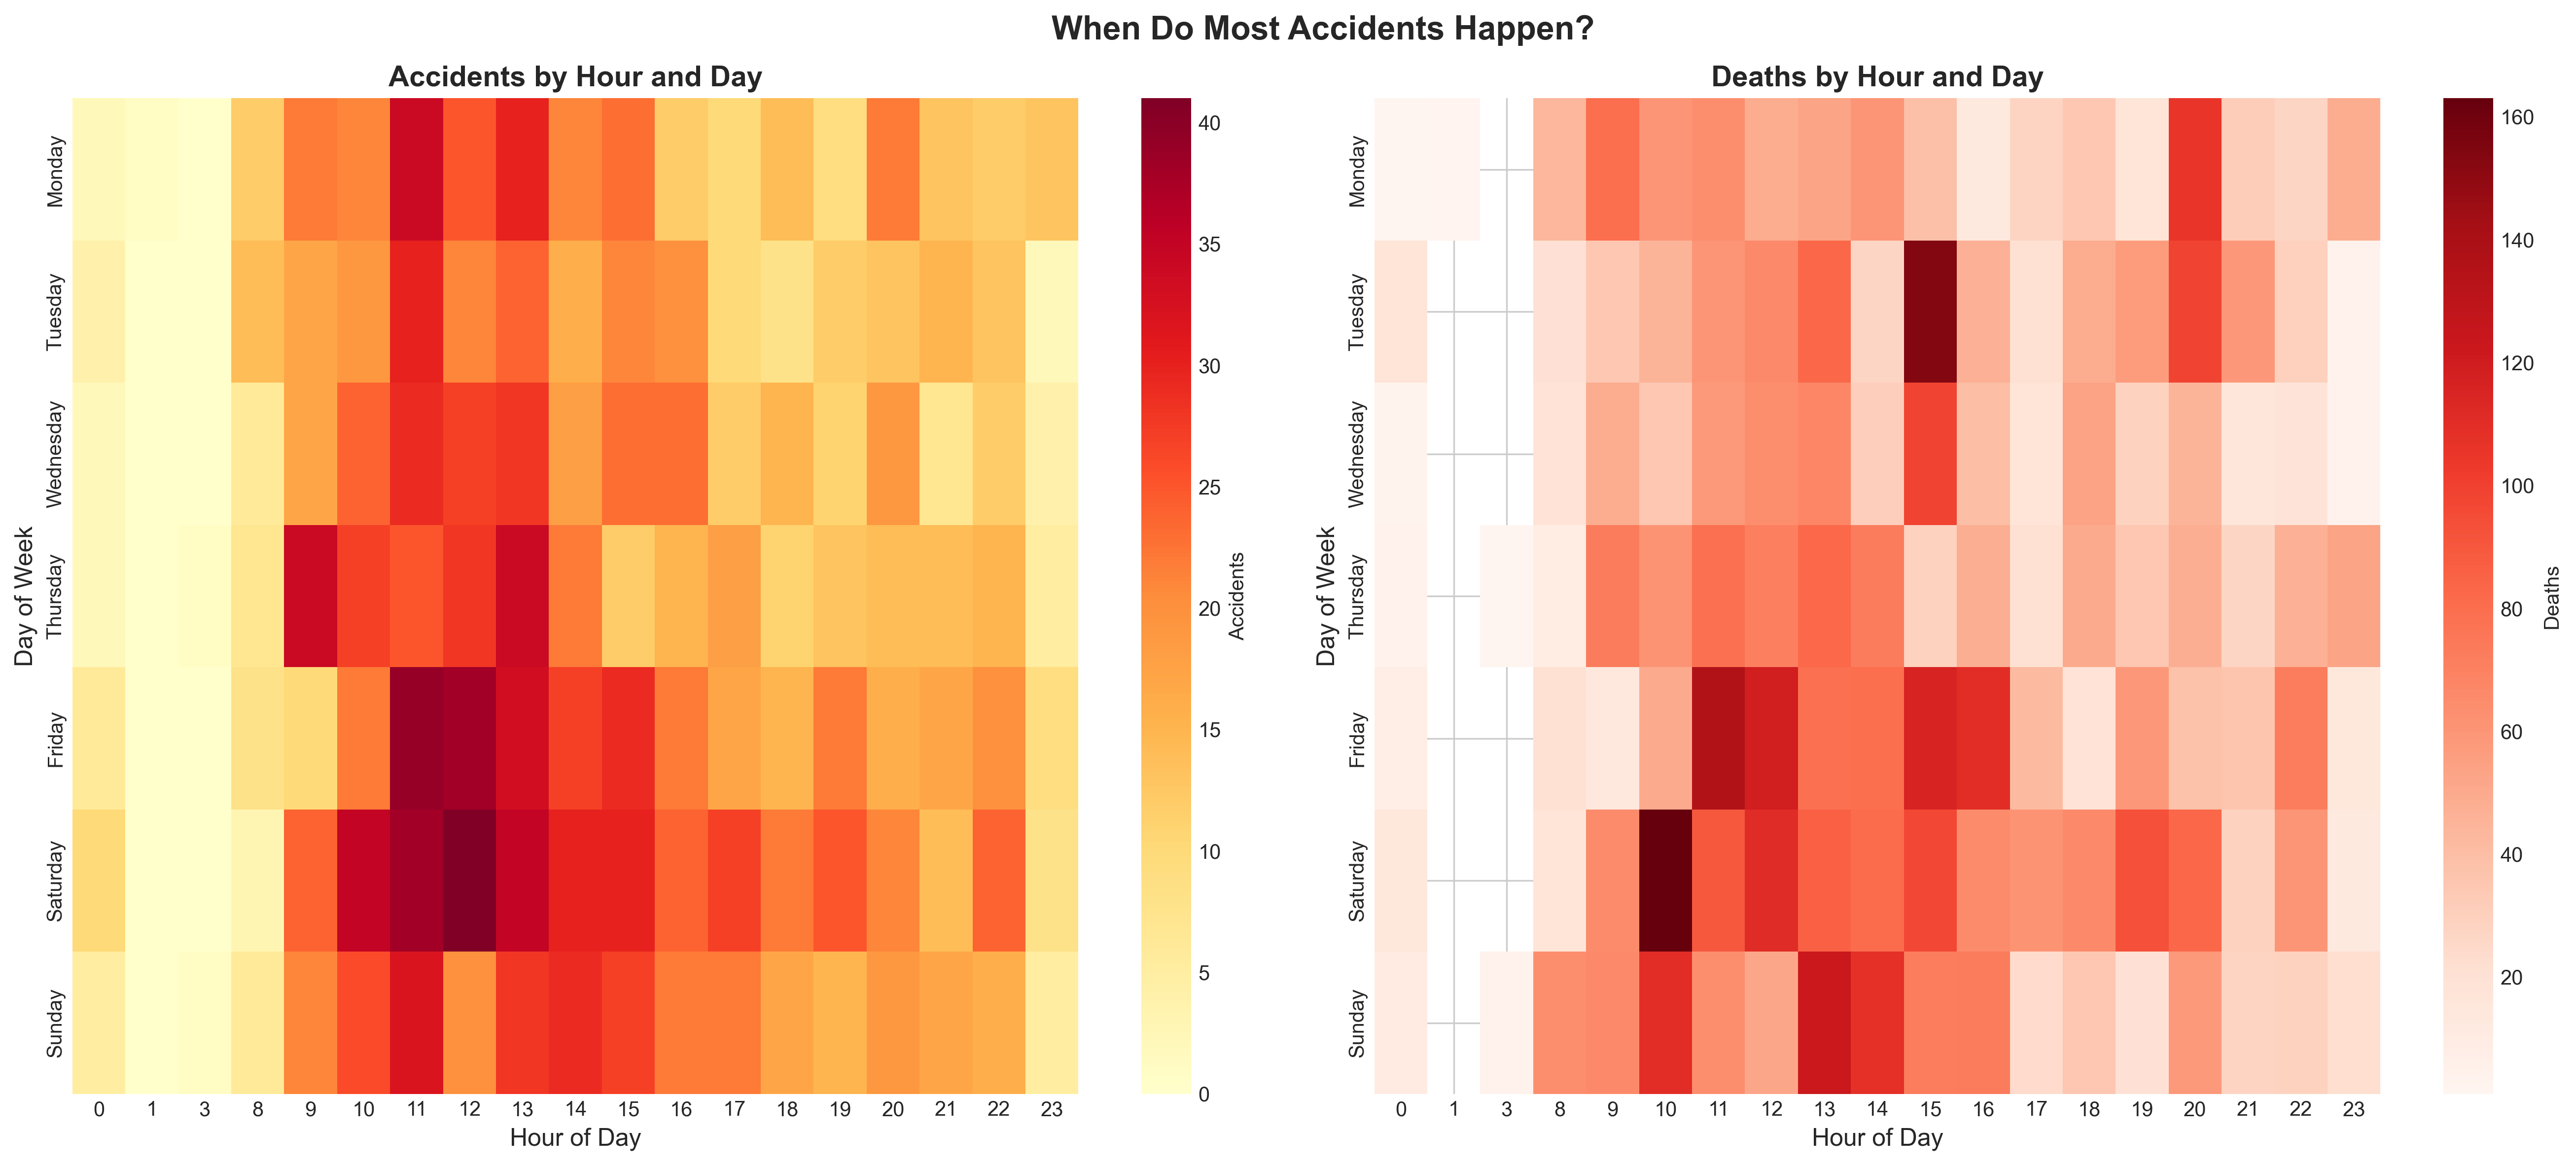
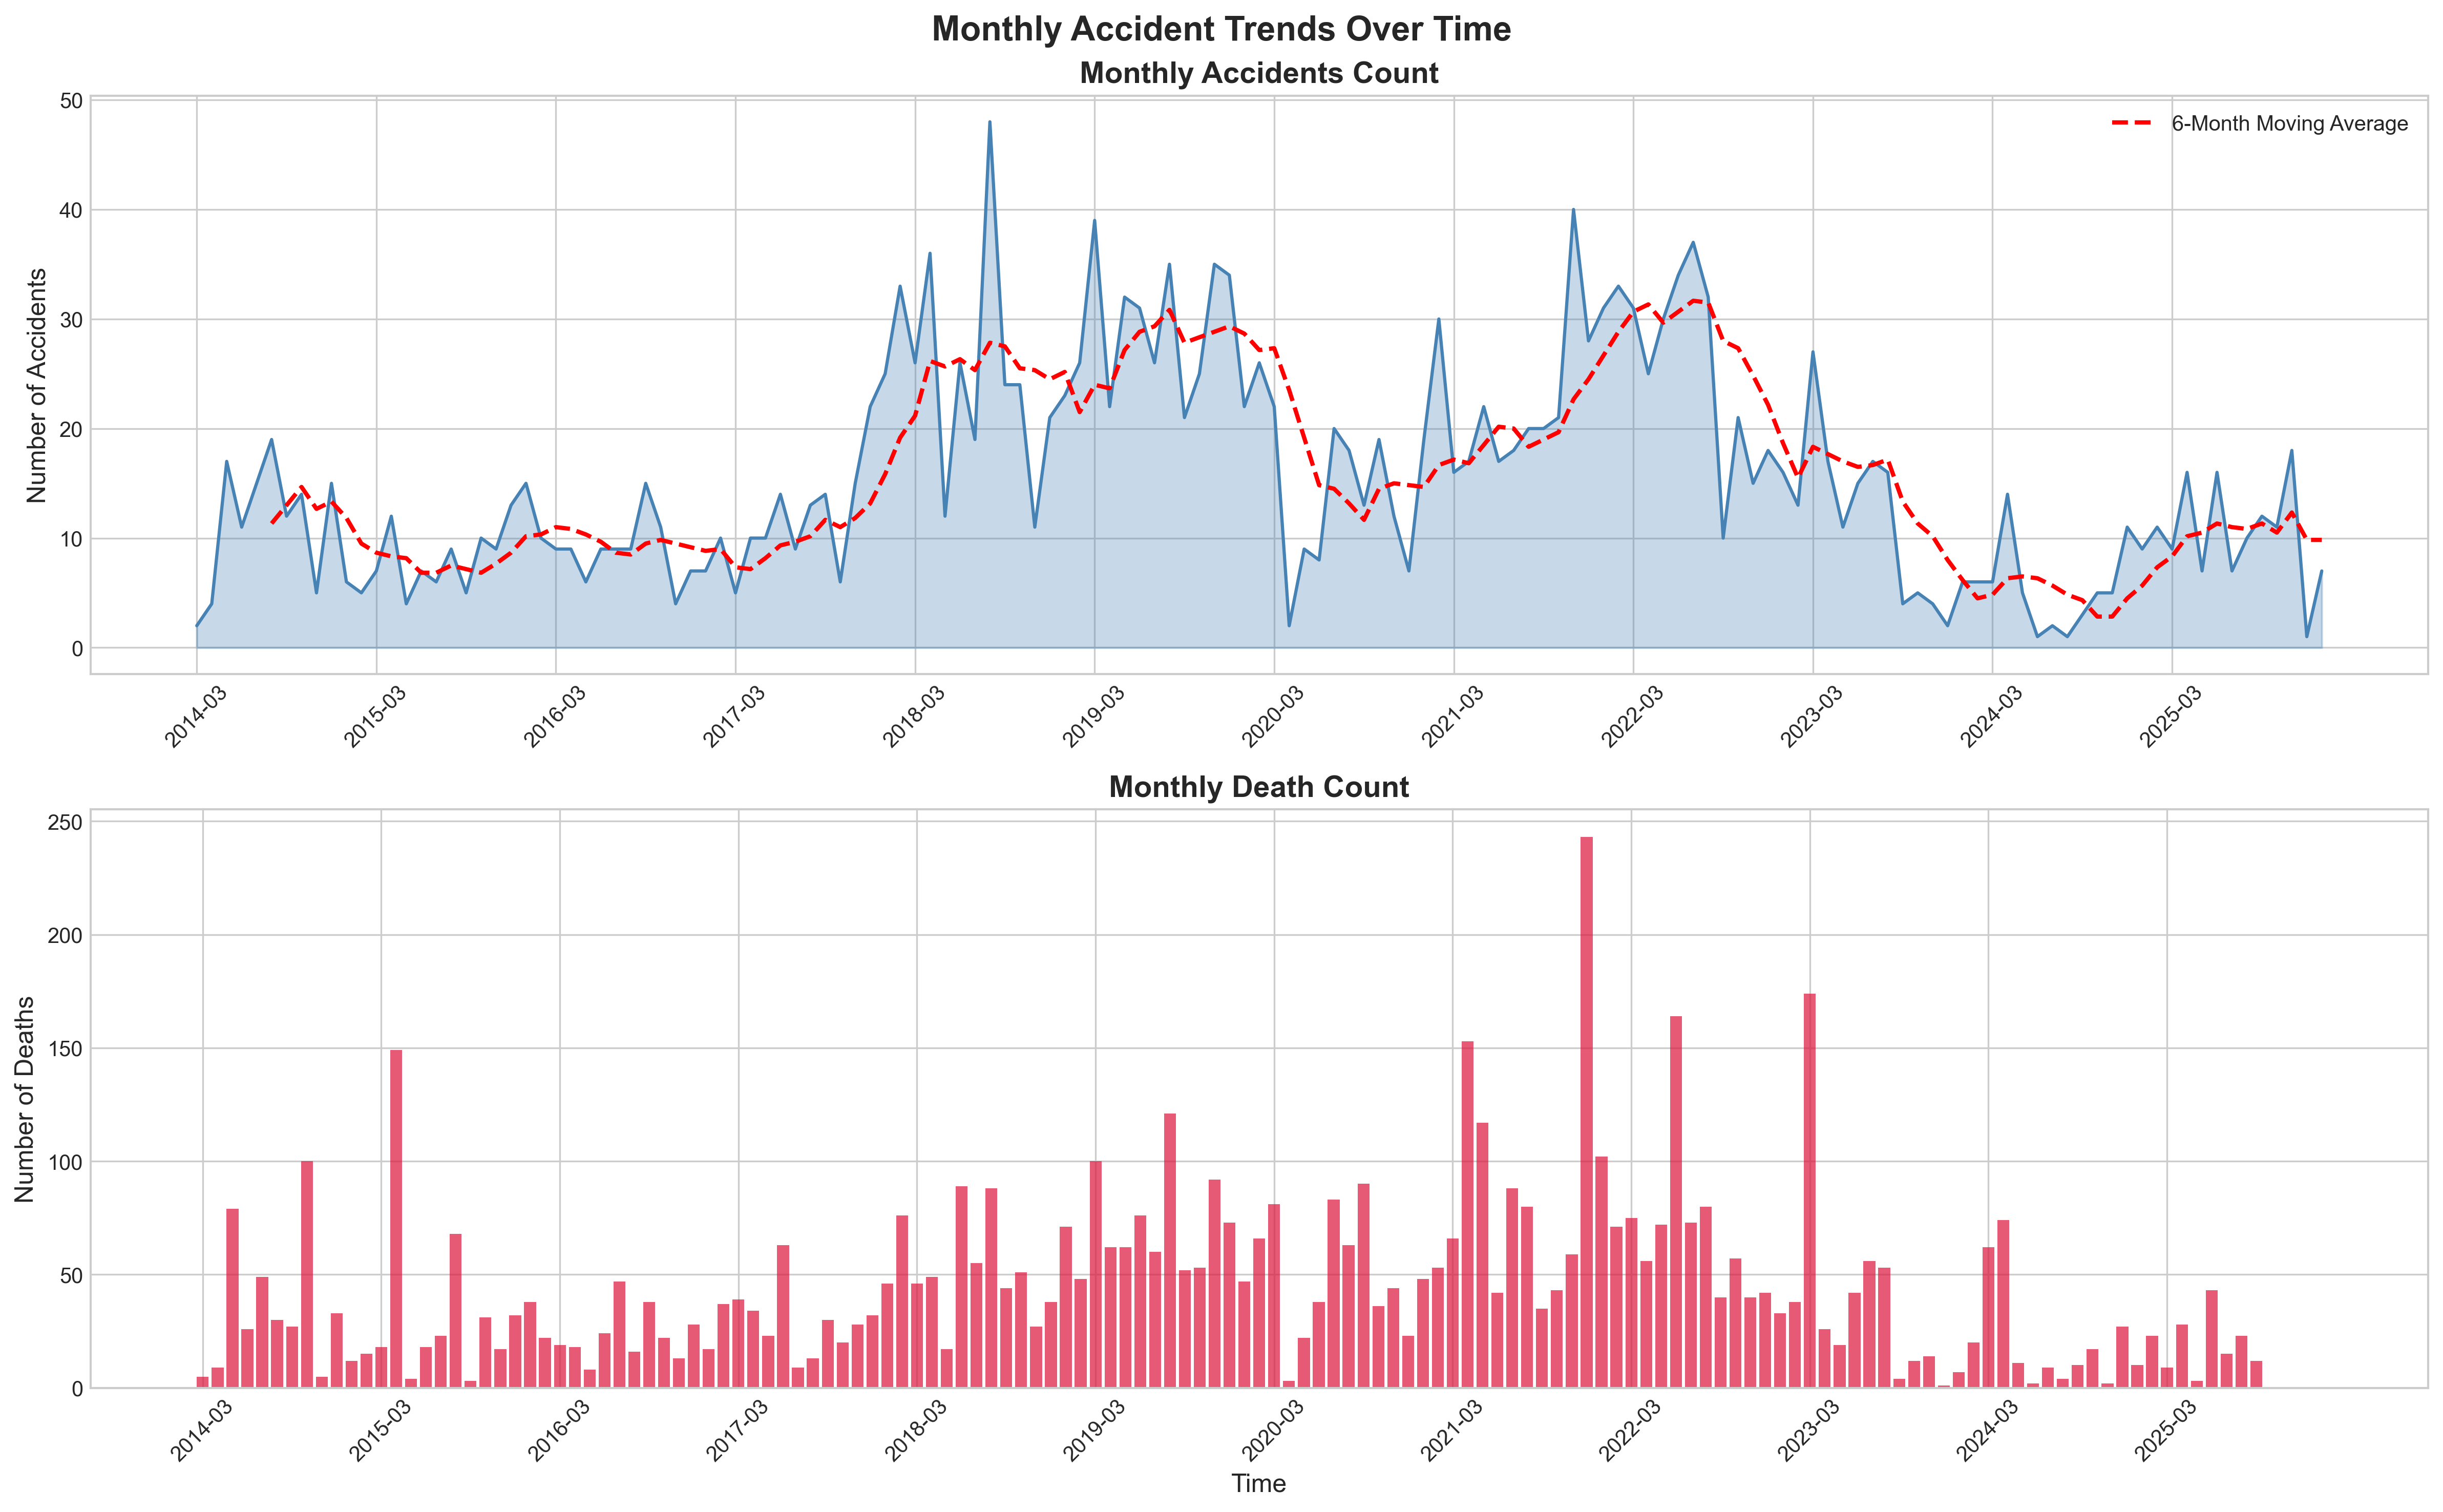
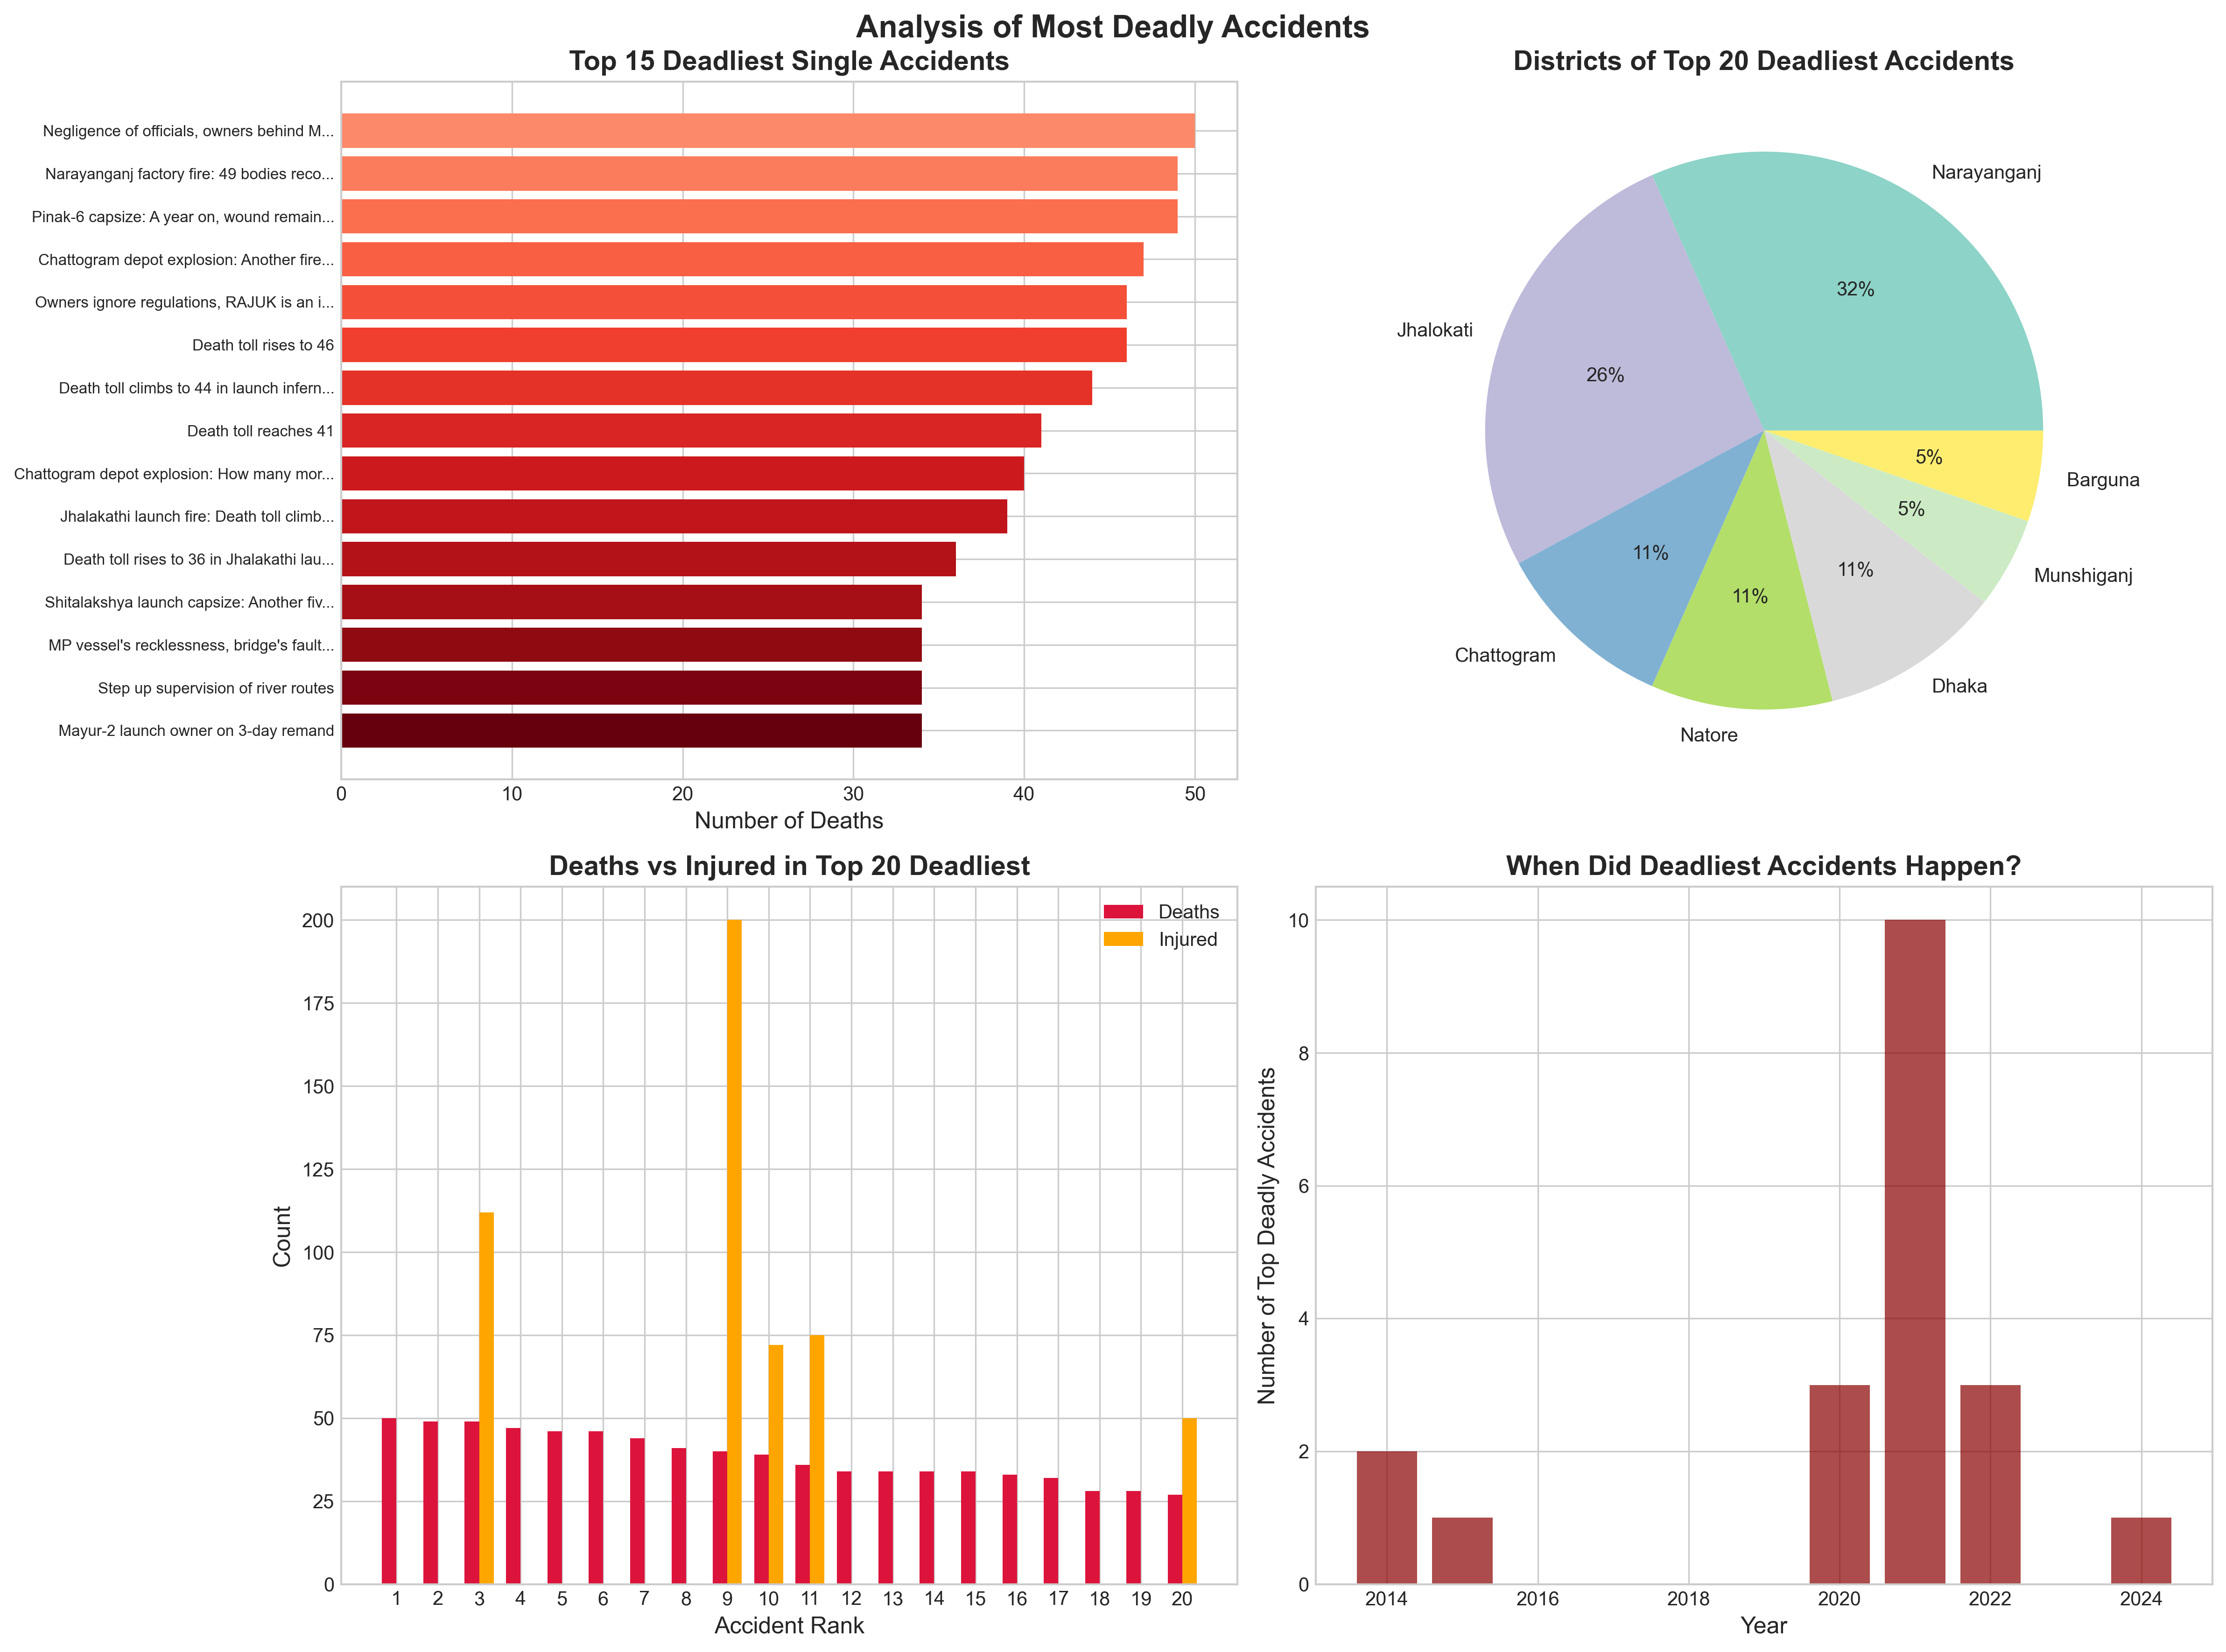
Visual Insights
Machine Learning Insights
What is this model?
We built a Random Forest Classification Model that predicts accident severity based on 6 key factors: district, vehicle type, time of day, month, weather conditions, and cause of accident.
The model classifies accidents into 3 severity levels:
- Minor (0 deaths) - Property damage only
- Moderate (1-2 deaths) - Limited casualties
- Severe (3+ deaths) - Major tragedy
By analyzing 2,218 historical accidents, the model achieves ~55% accuracy and reveals which factors most strongly predict fatal outcomes. This helps policymakers focus safety interventions where they matter most.
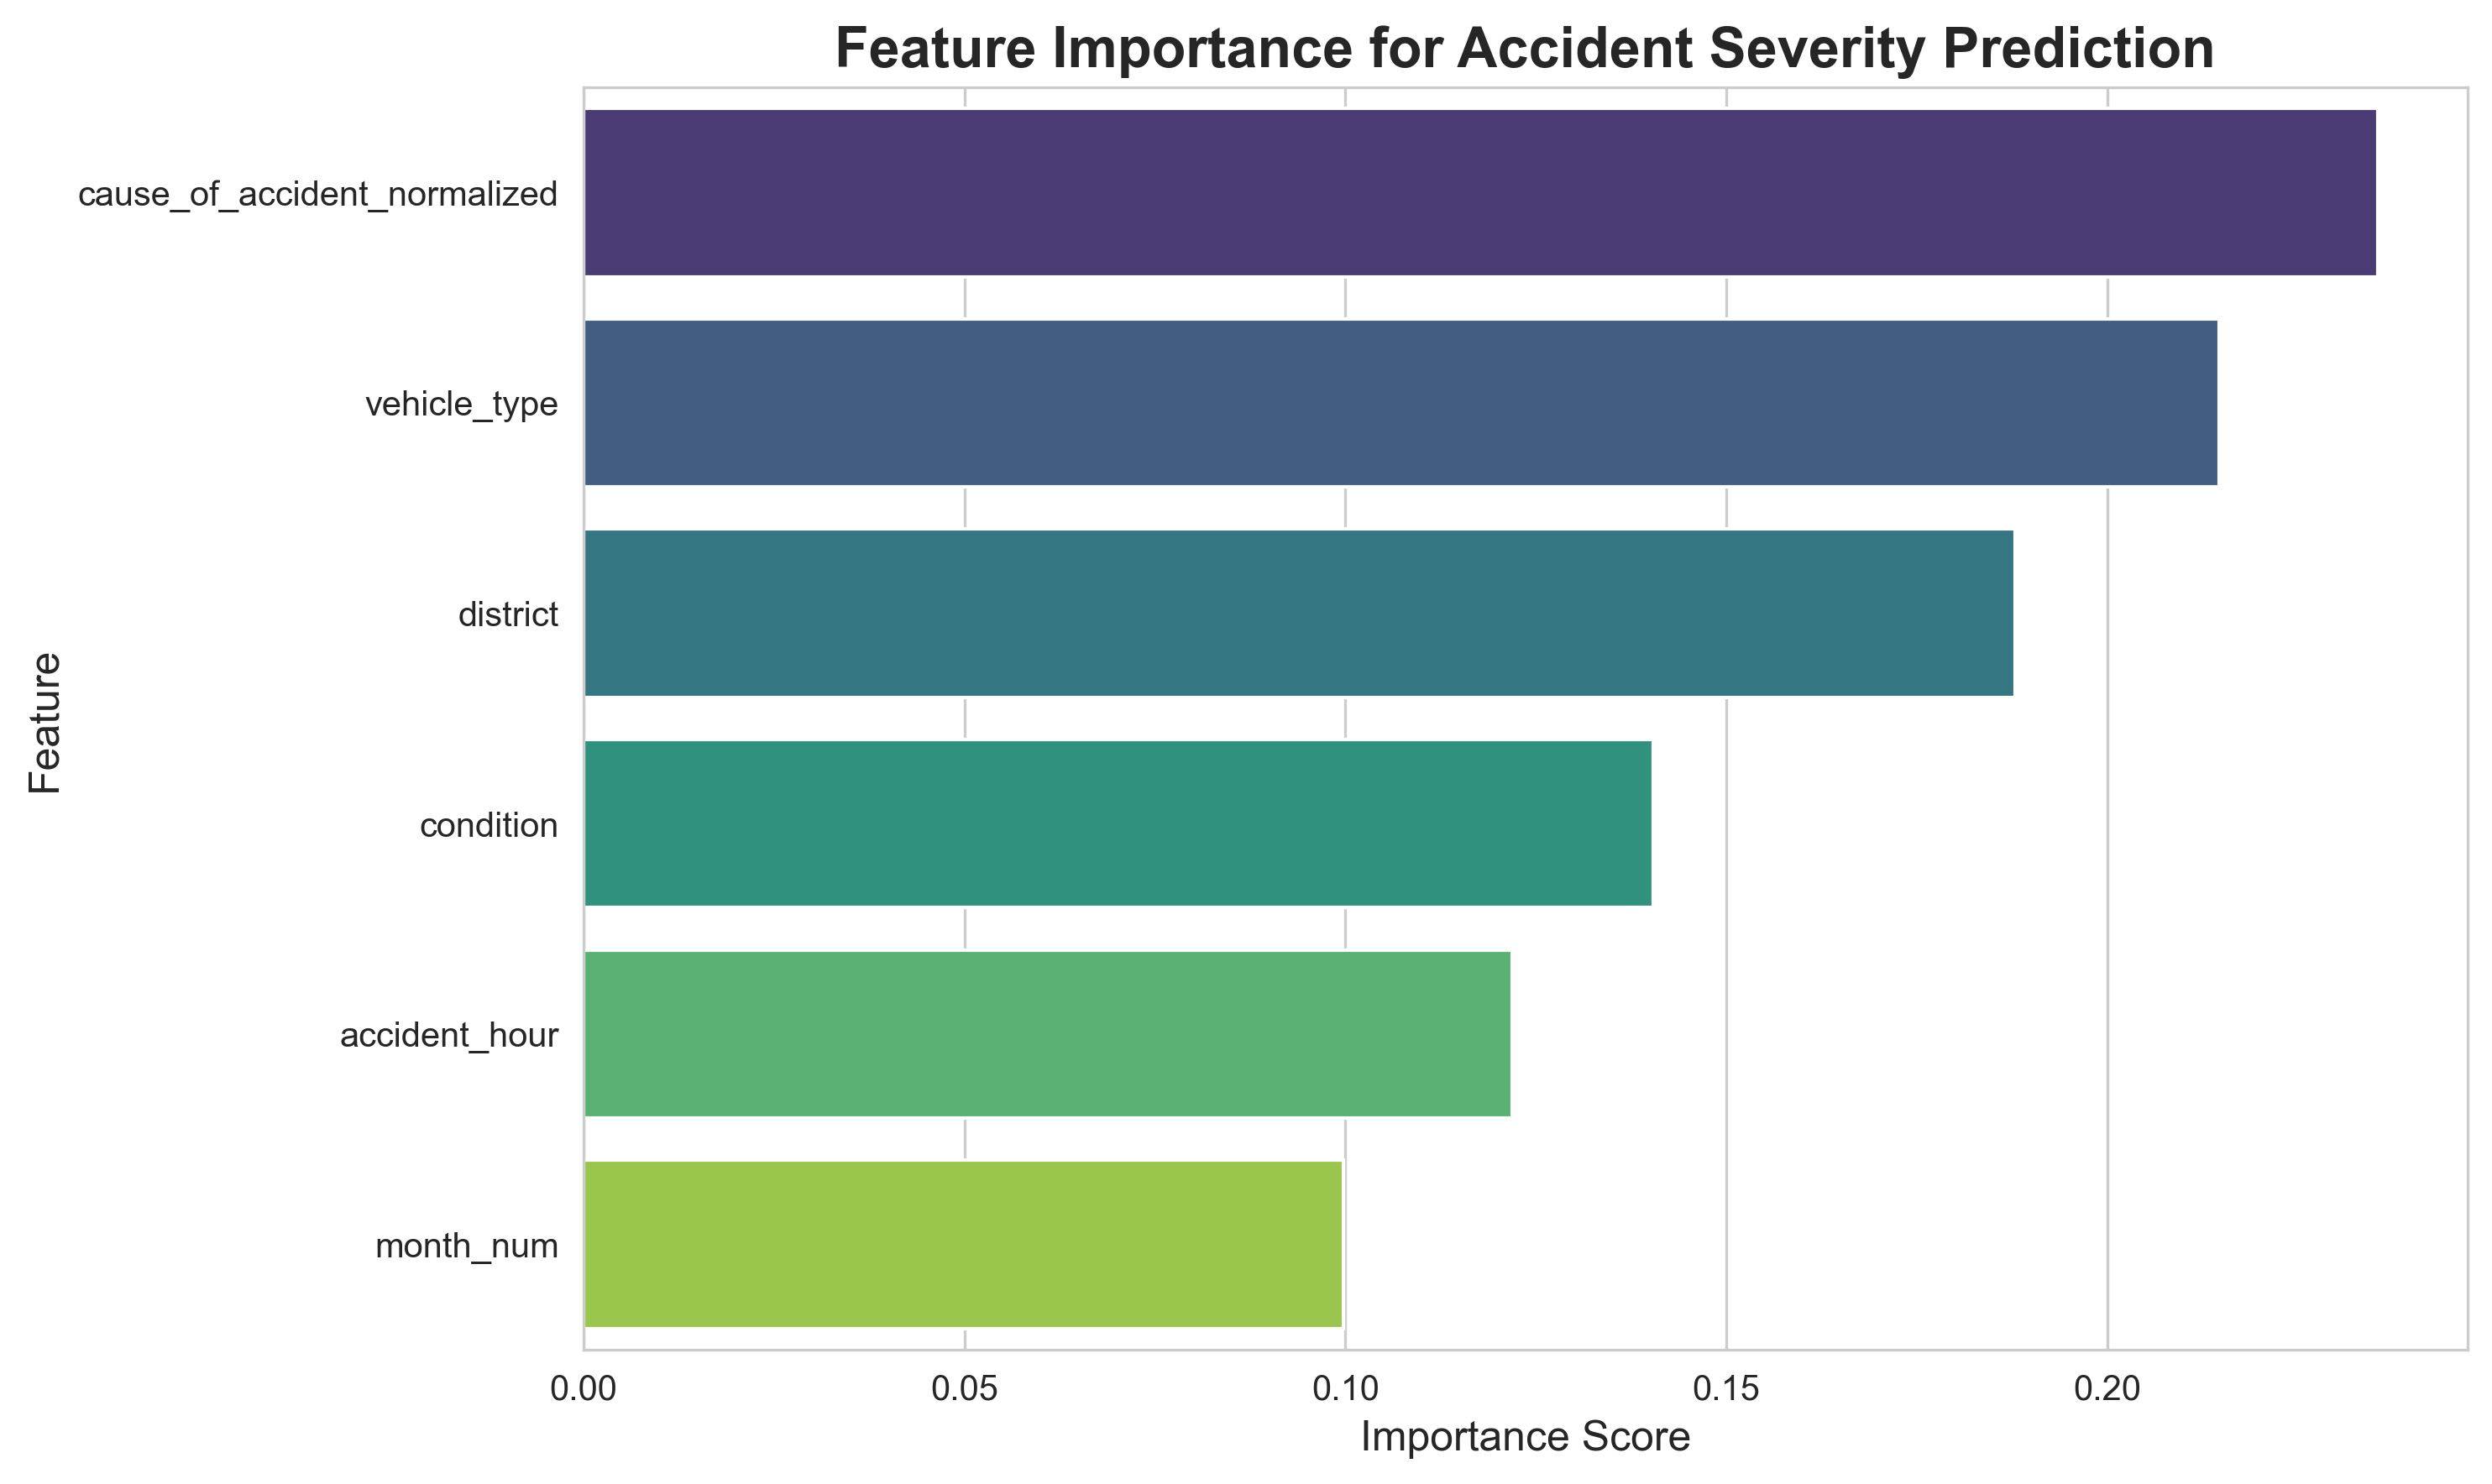
What Matters Most?
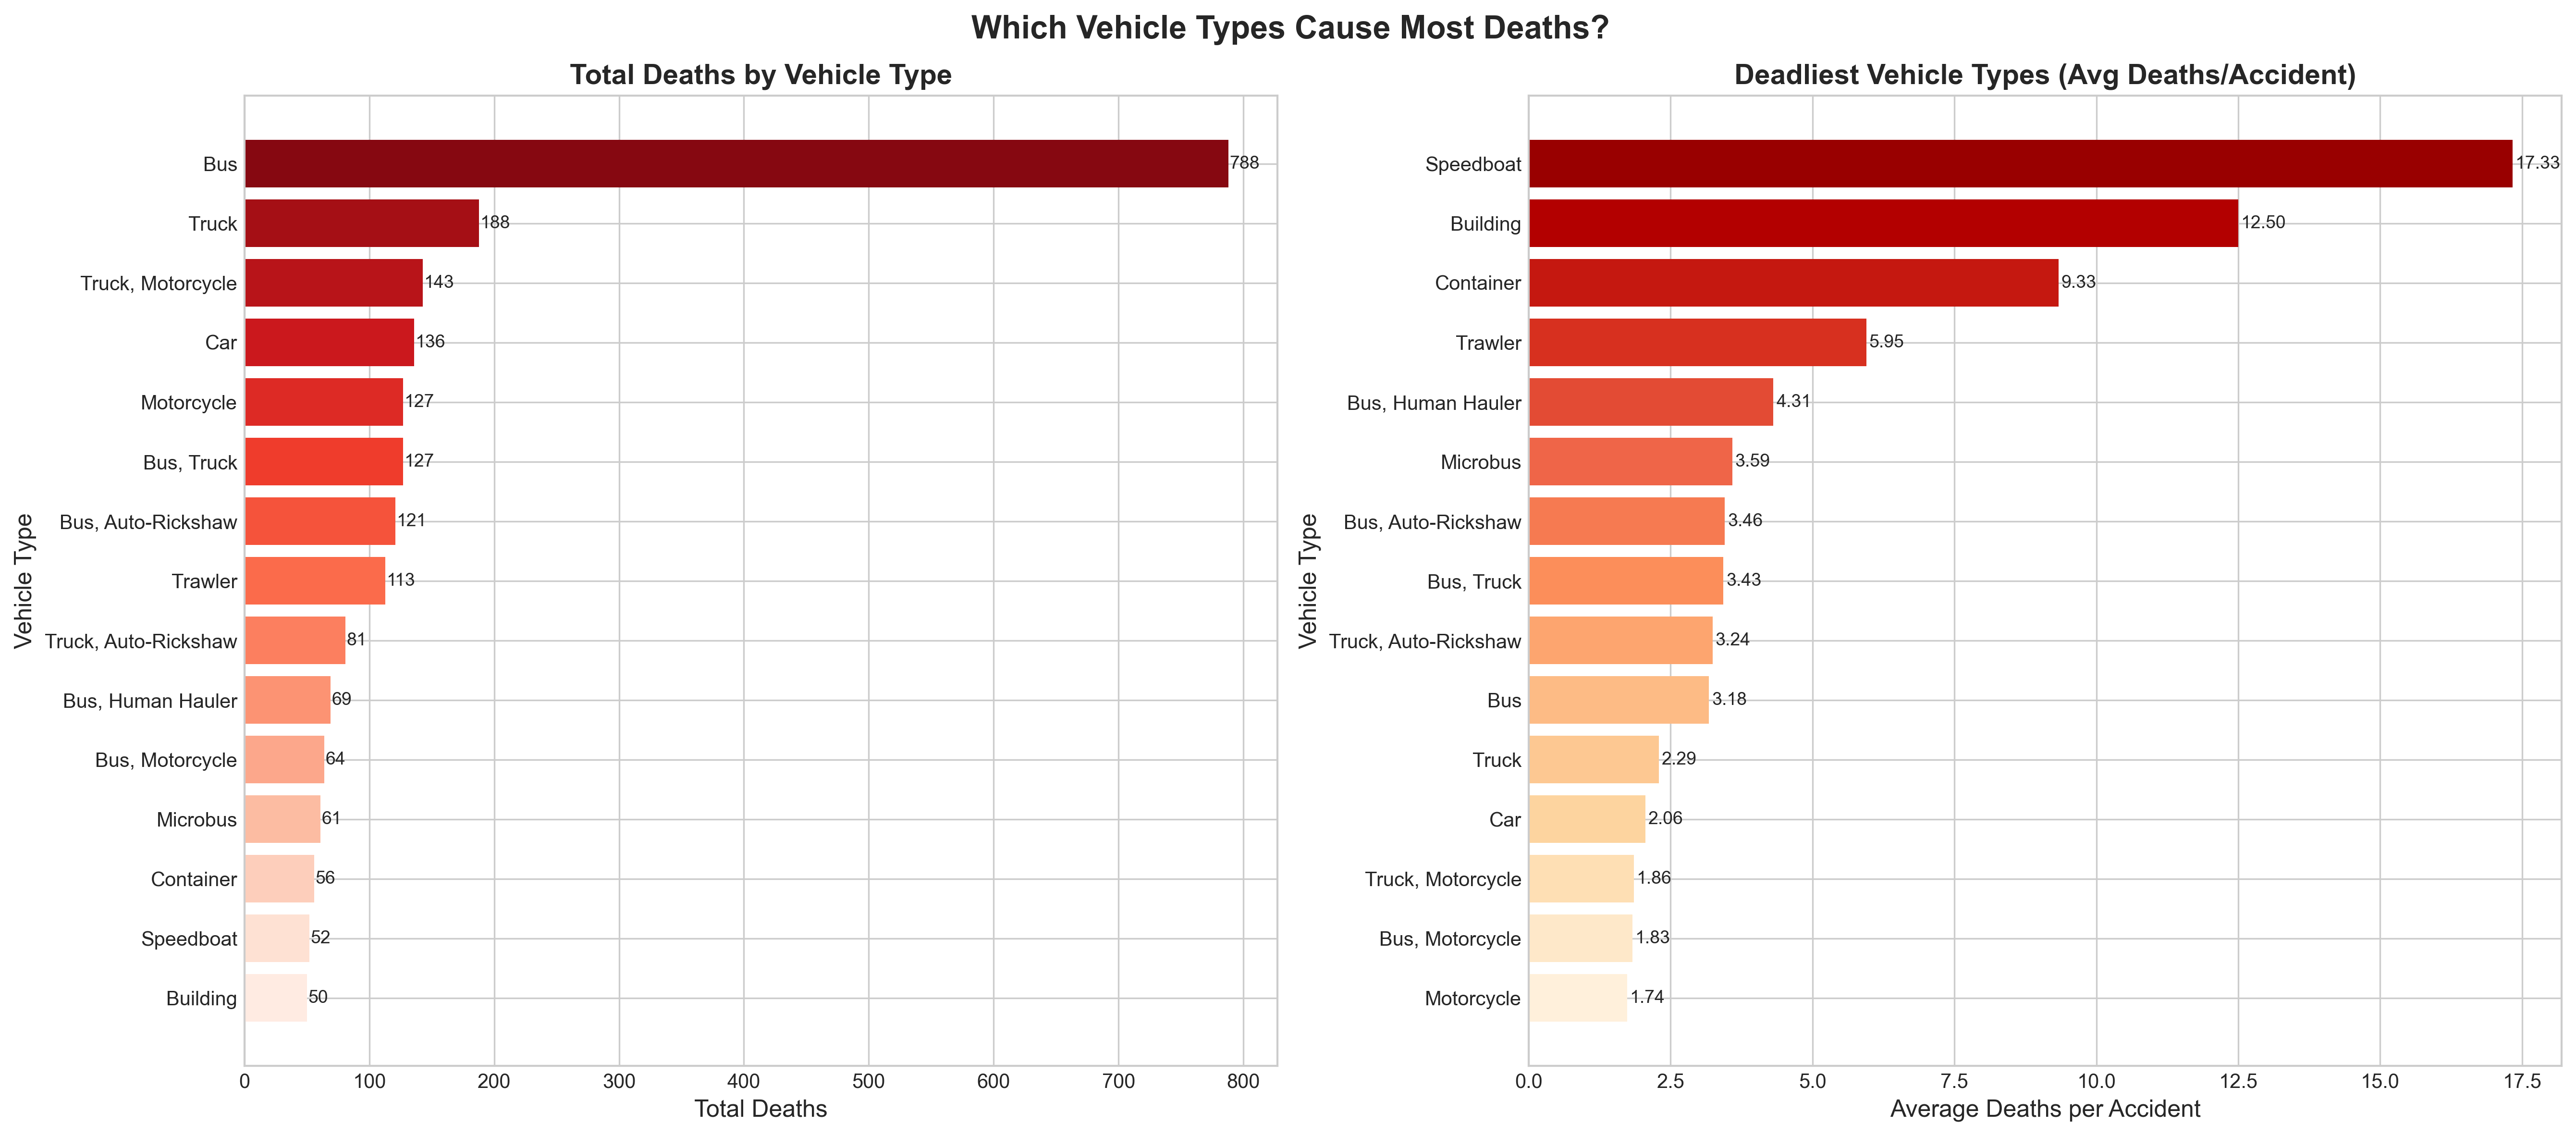
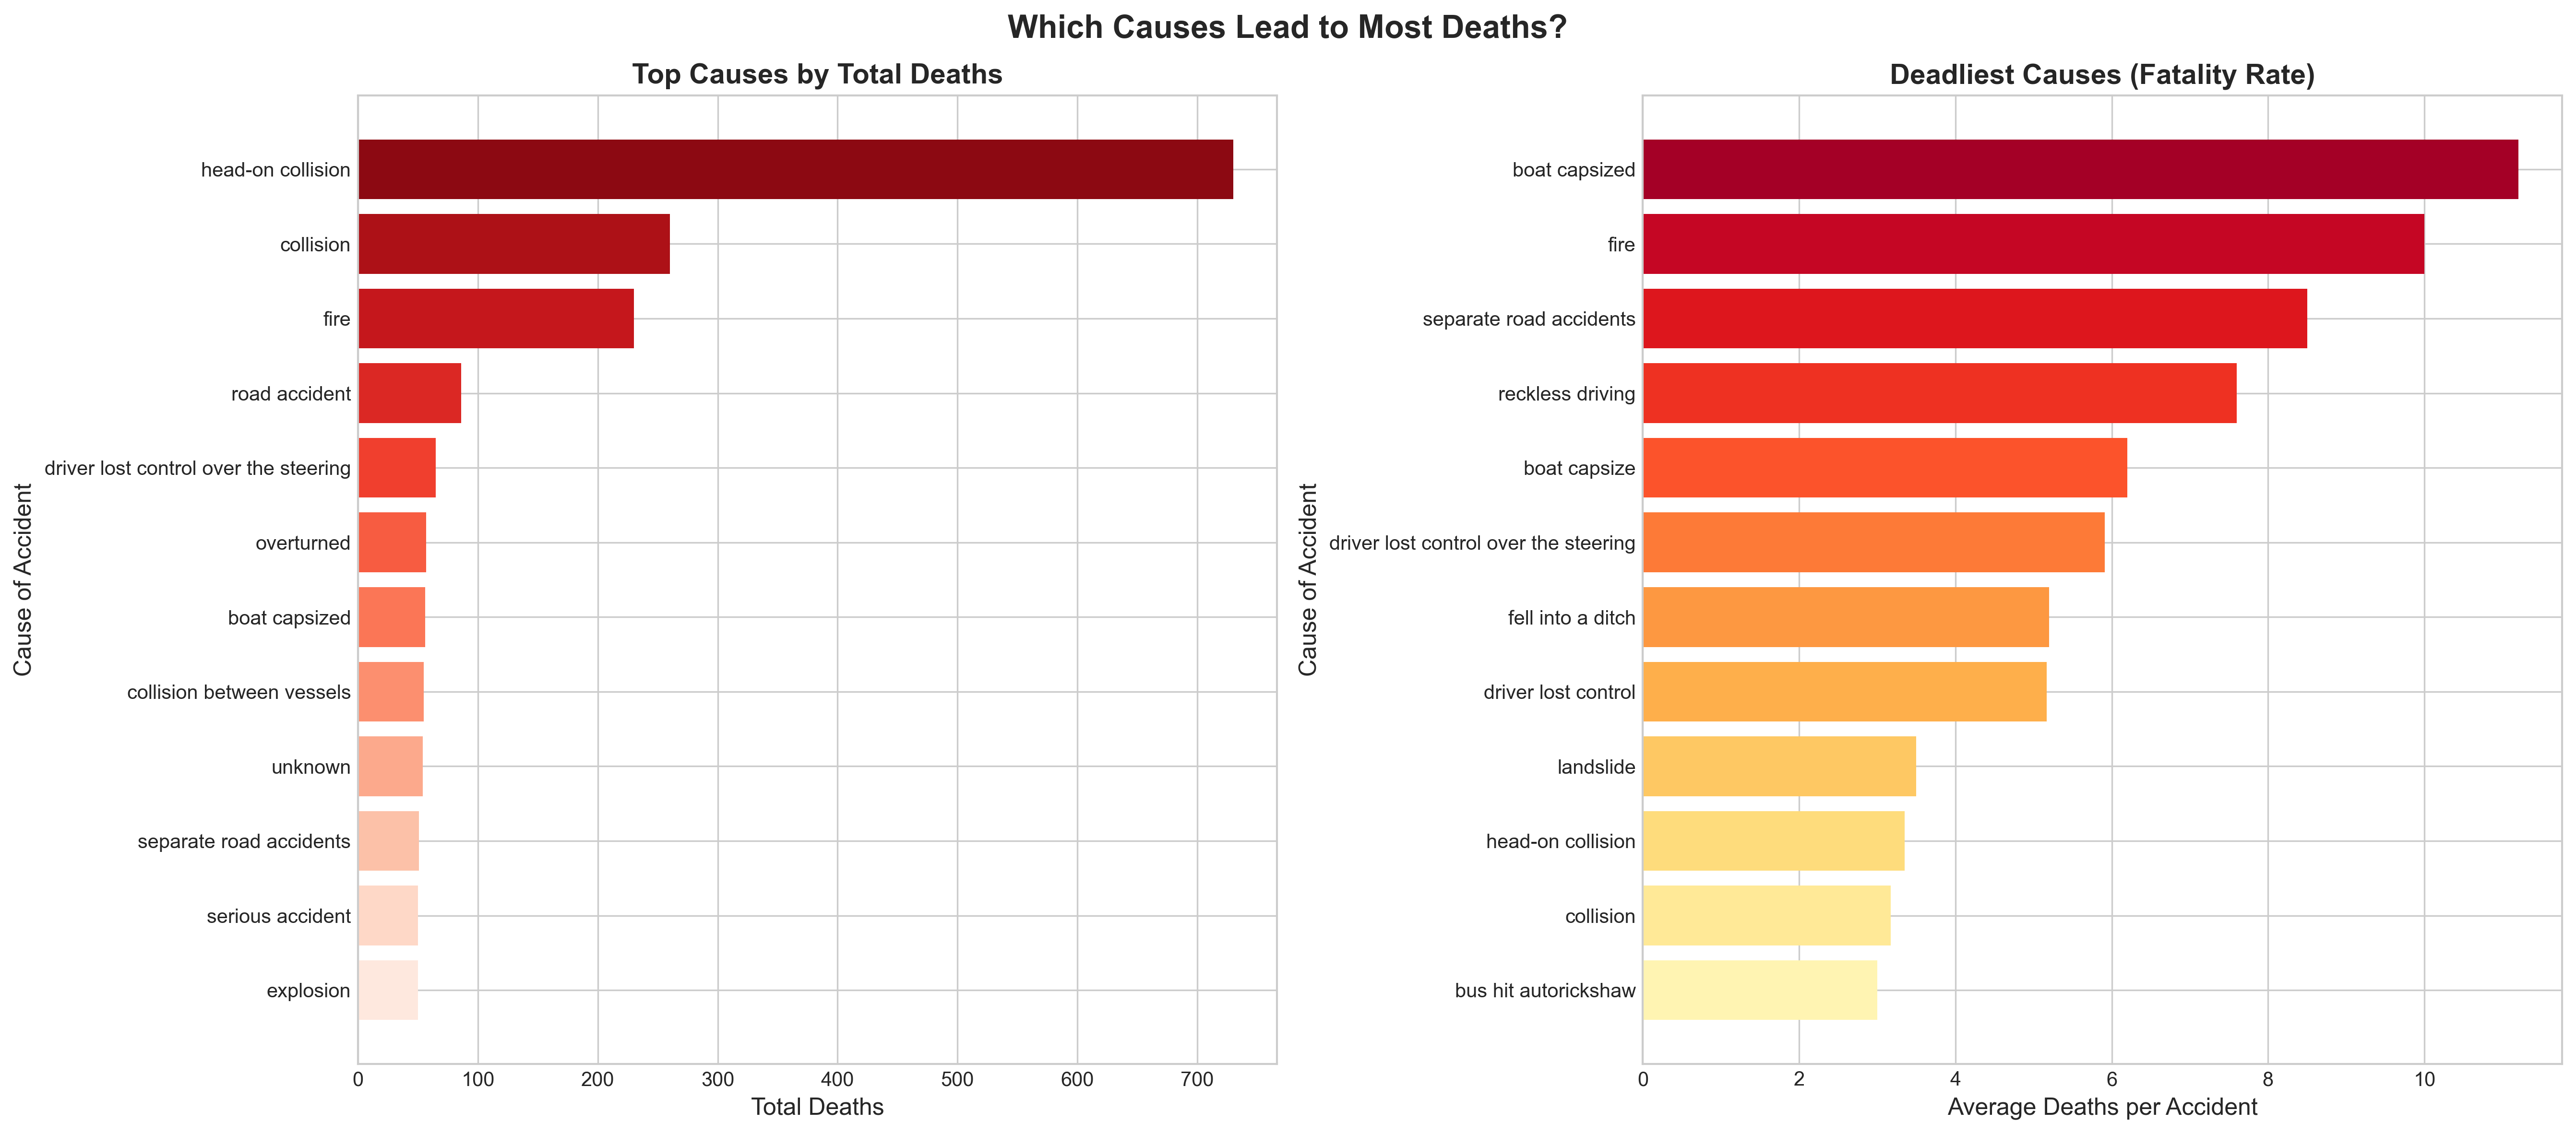
Cause of accident is the #1 predictor (22.5% importance). Head-on collisions and fires are inherently more deadly than minor fender-benders. Vehicle type ranks second - trucks cause more damage than motorcycles. District location matters due to hospital access and road quality.
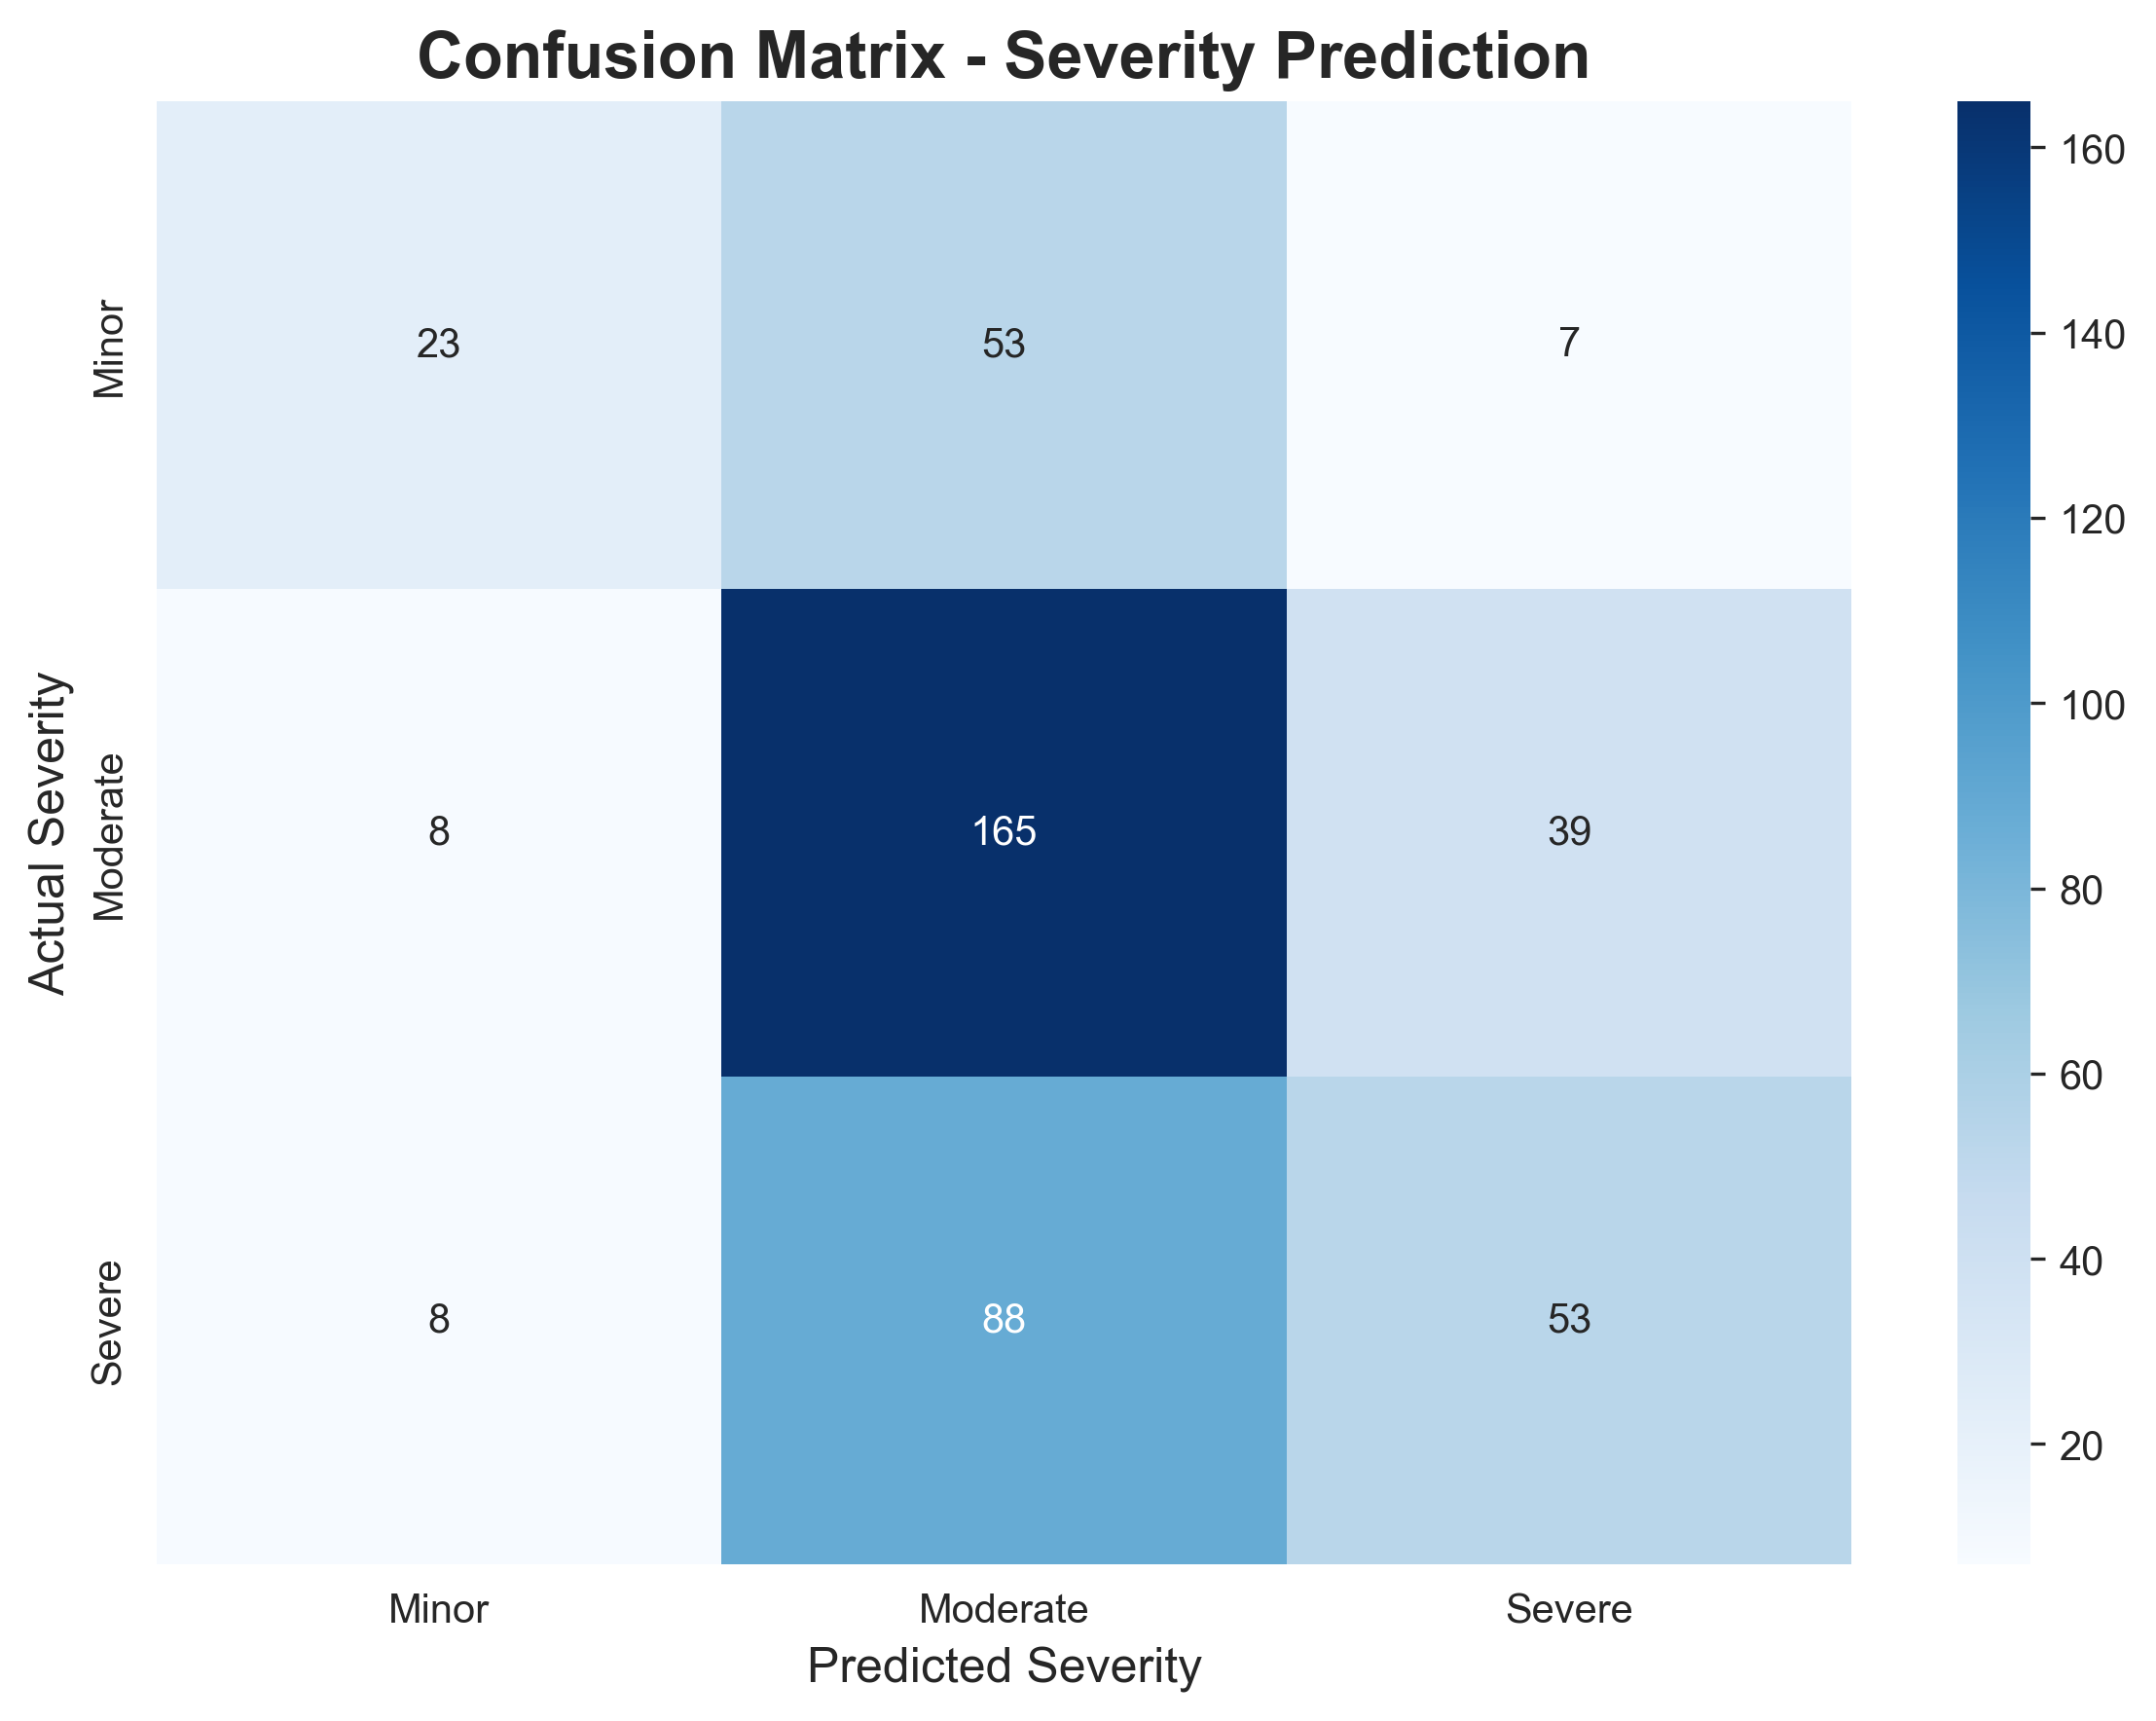
Model Performance
The model is best at predicting Moderate severity (165 correct predictions). It struggles with Minor accidents, often predicting them as Moderate. This is expected - the difference between 2 and 3 deaths often comes down to factors not in our data (seatbelt use, emergency response time).
Key Takeaways
For Policymakers: Focus on preventing head-on collisions through better road design and traffic enforcement. Target high-risk districts (Dhaka, Chattogram) with enhanced safety measures.
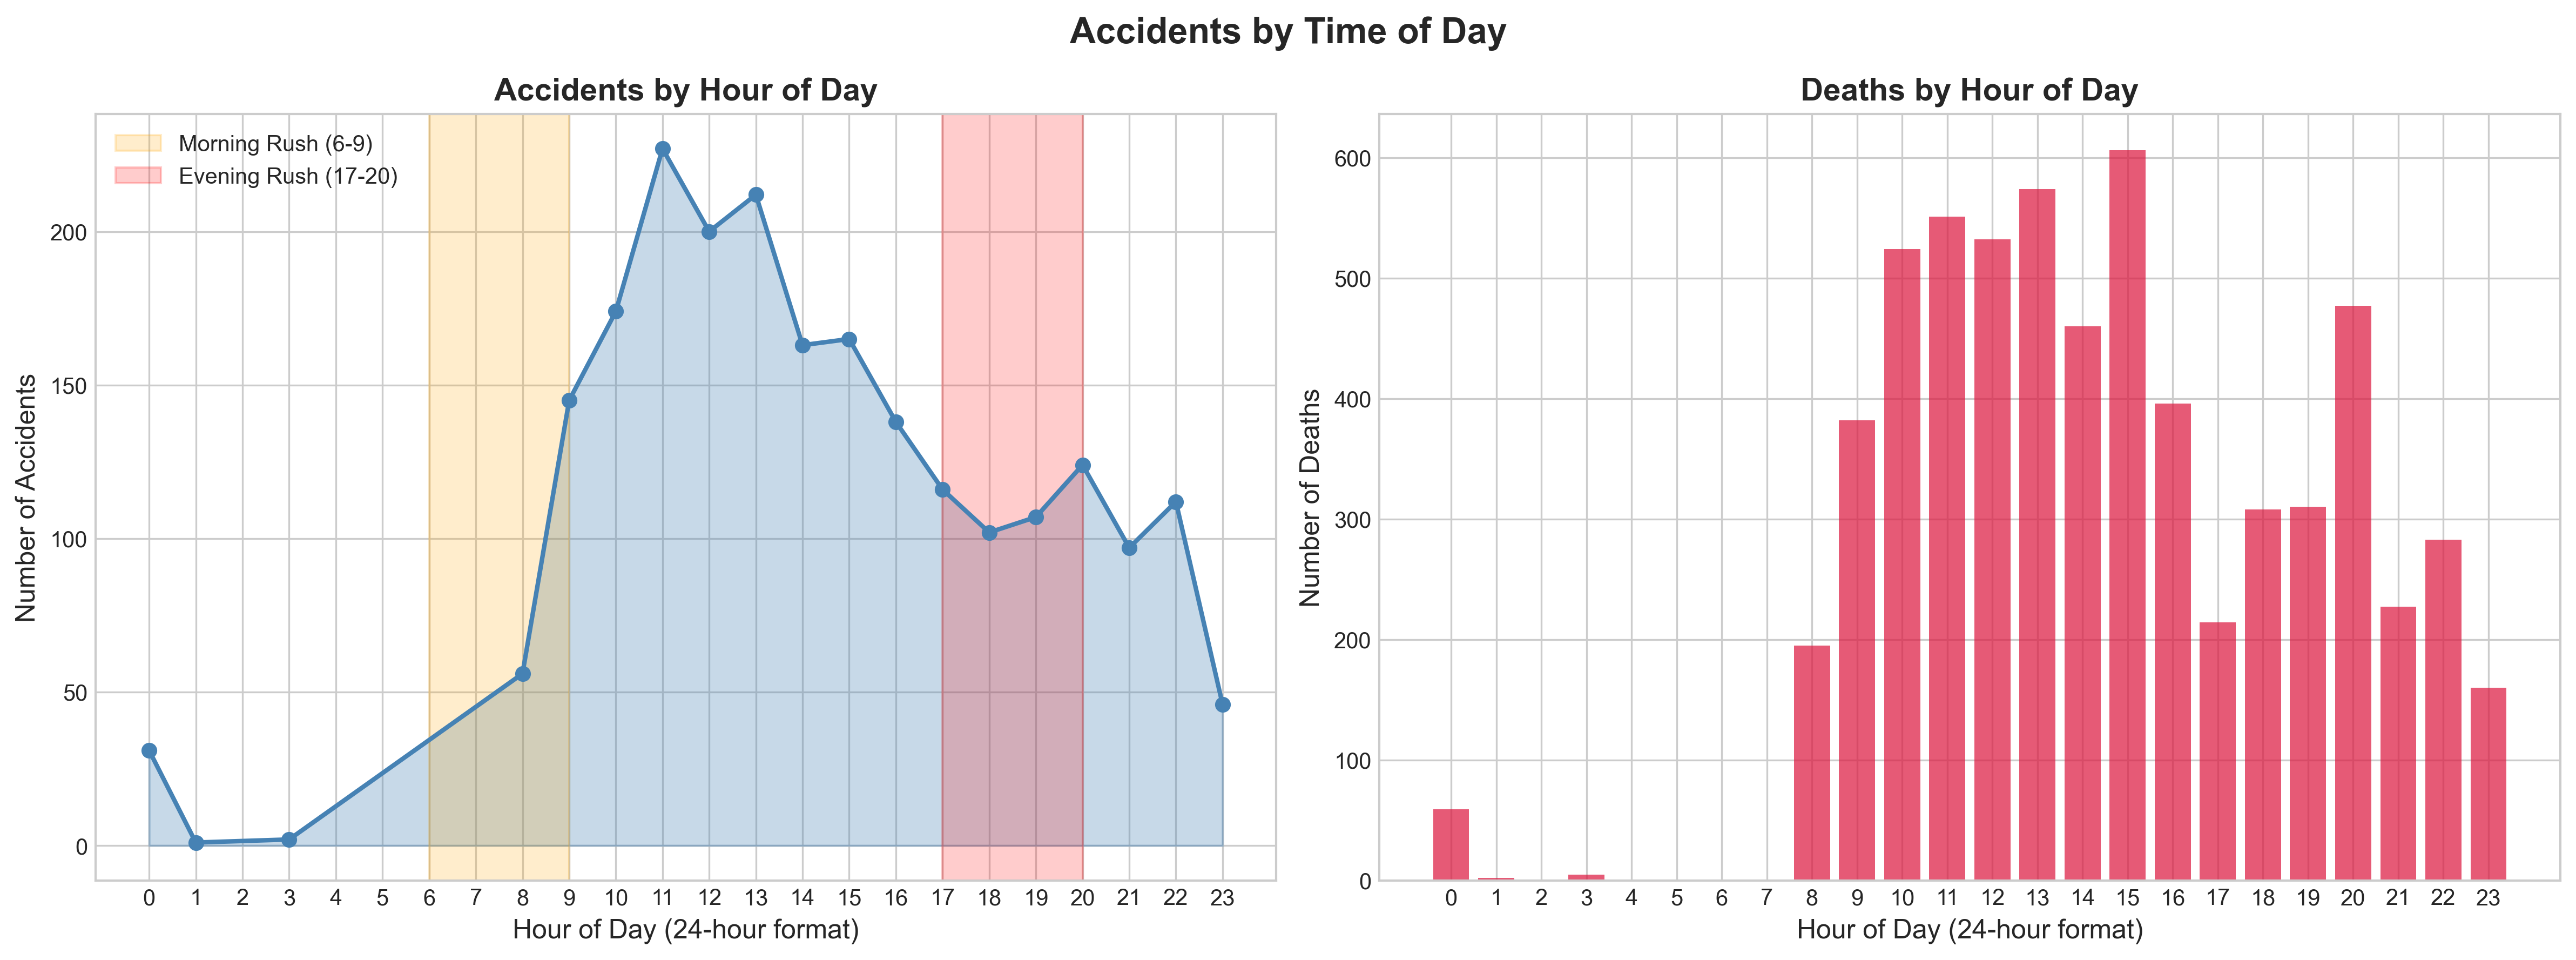
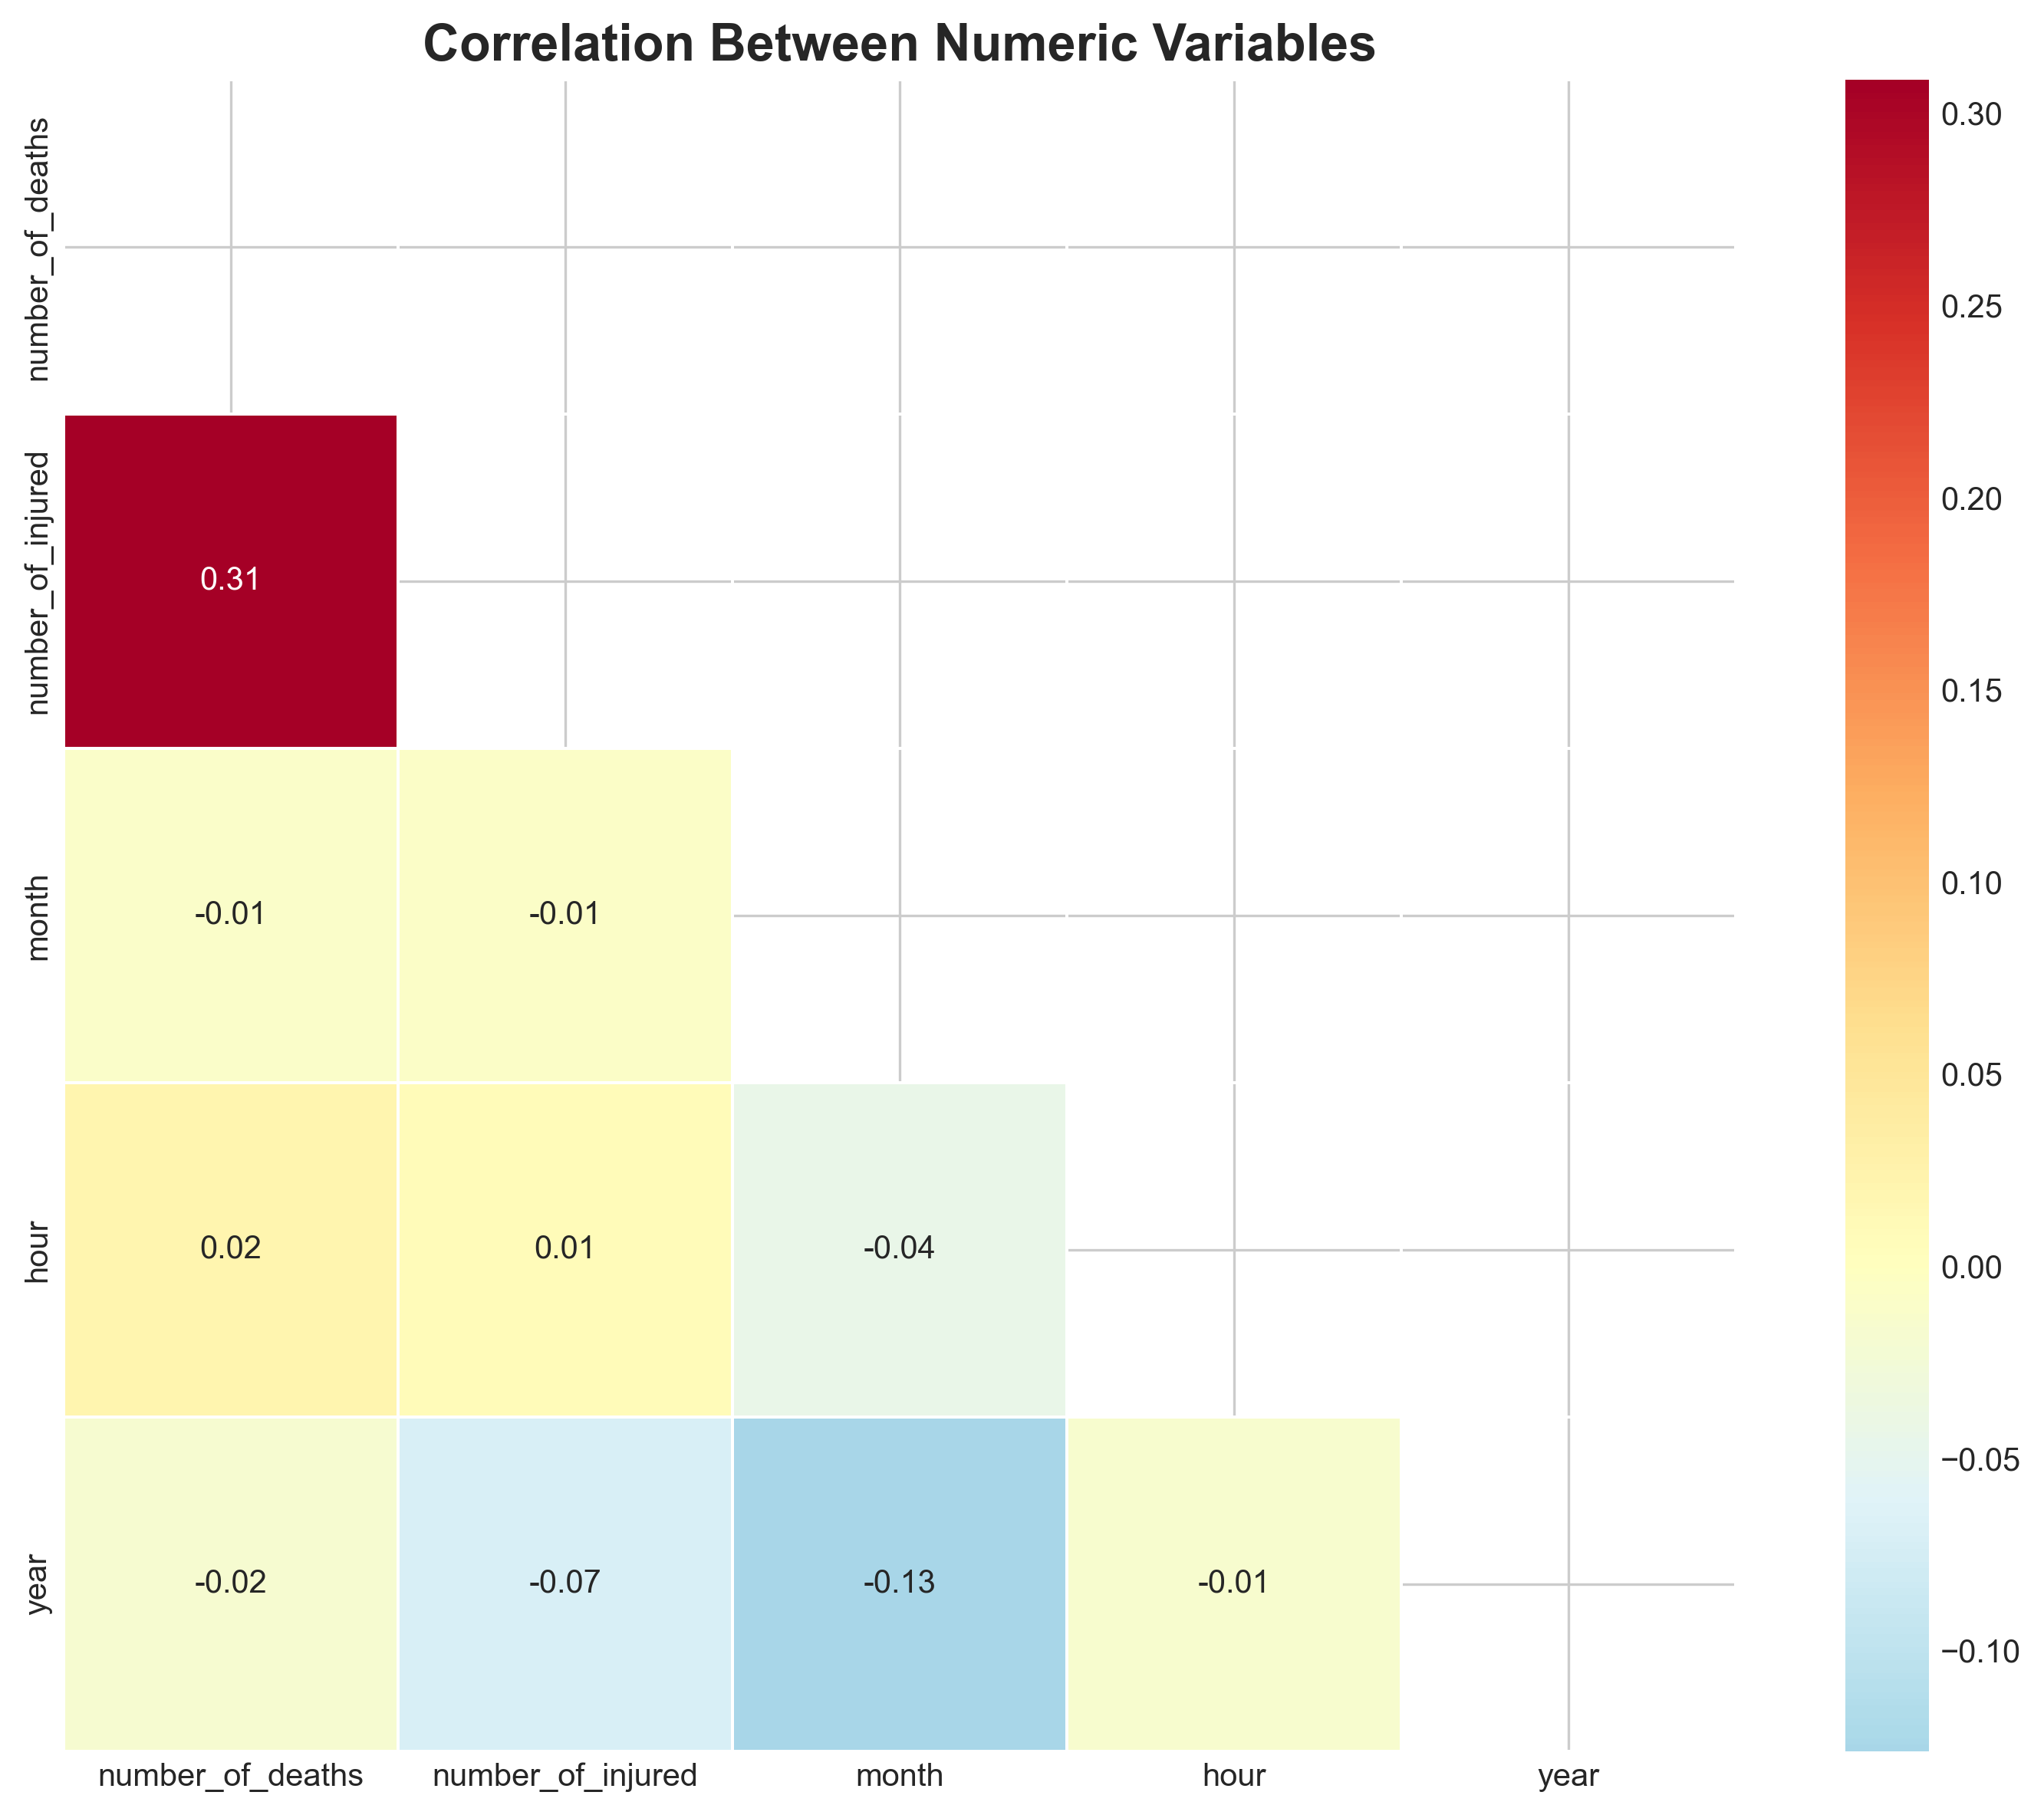
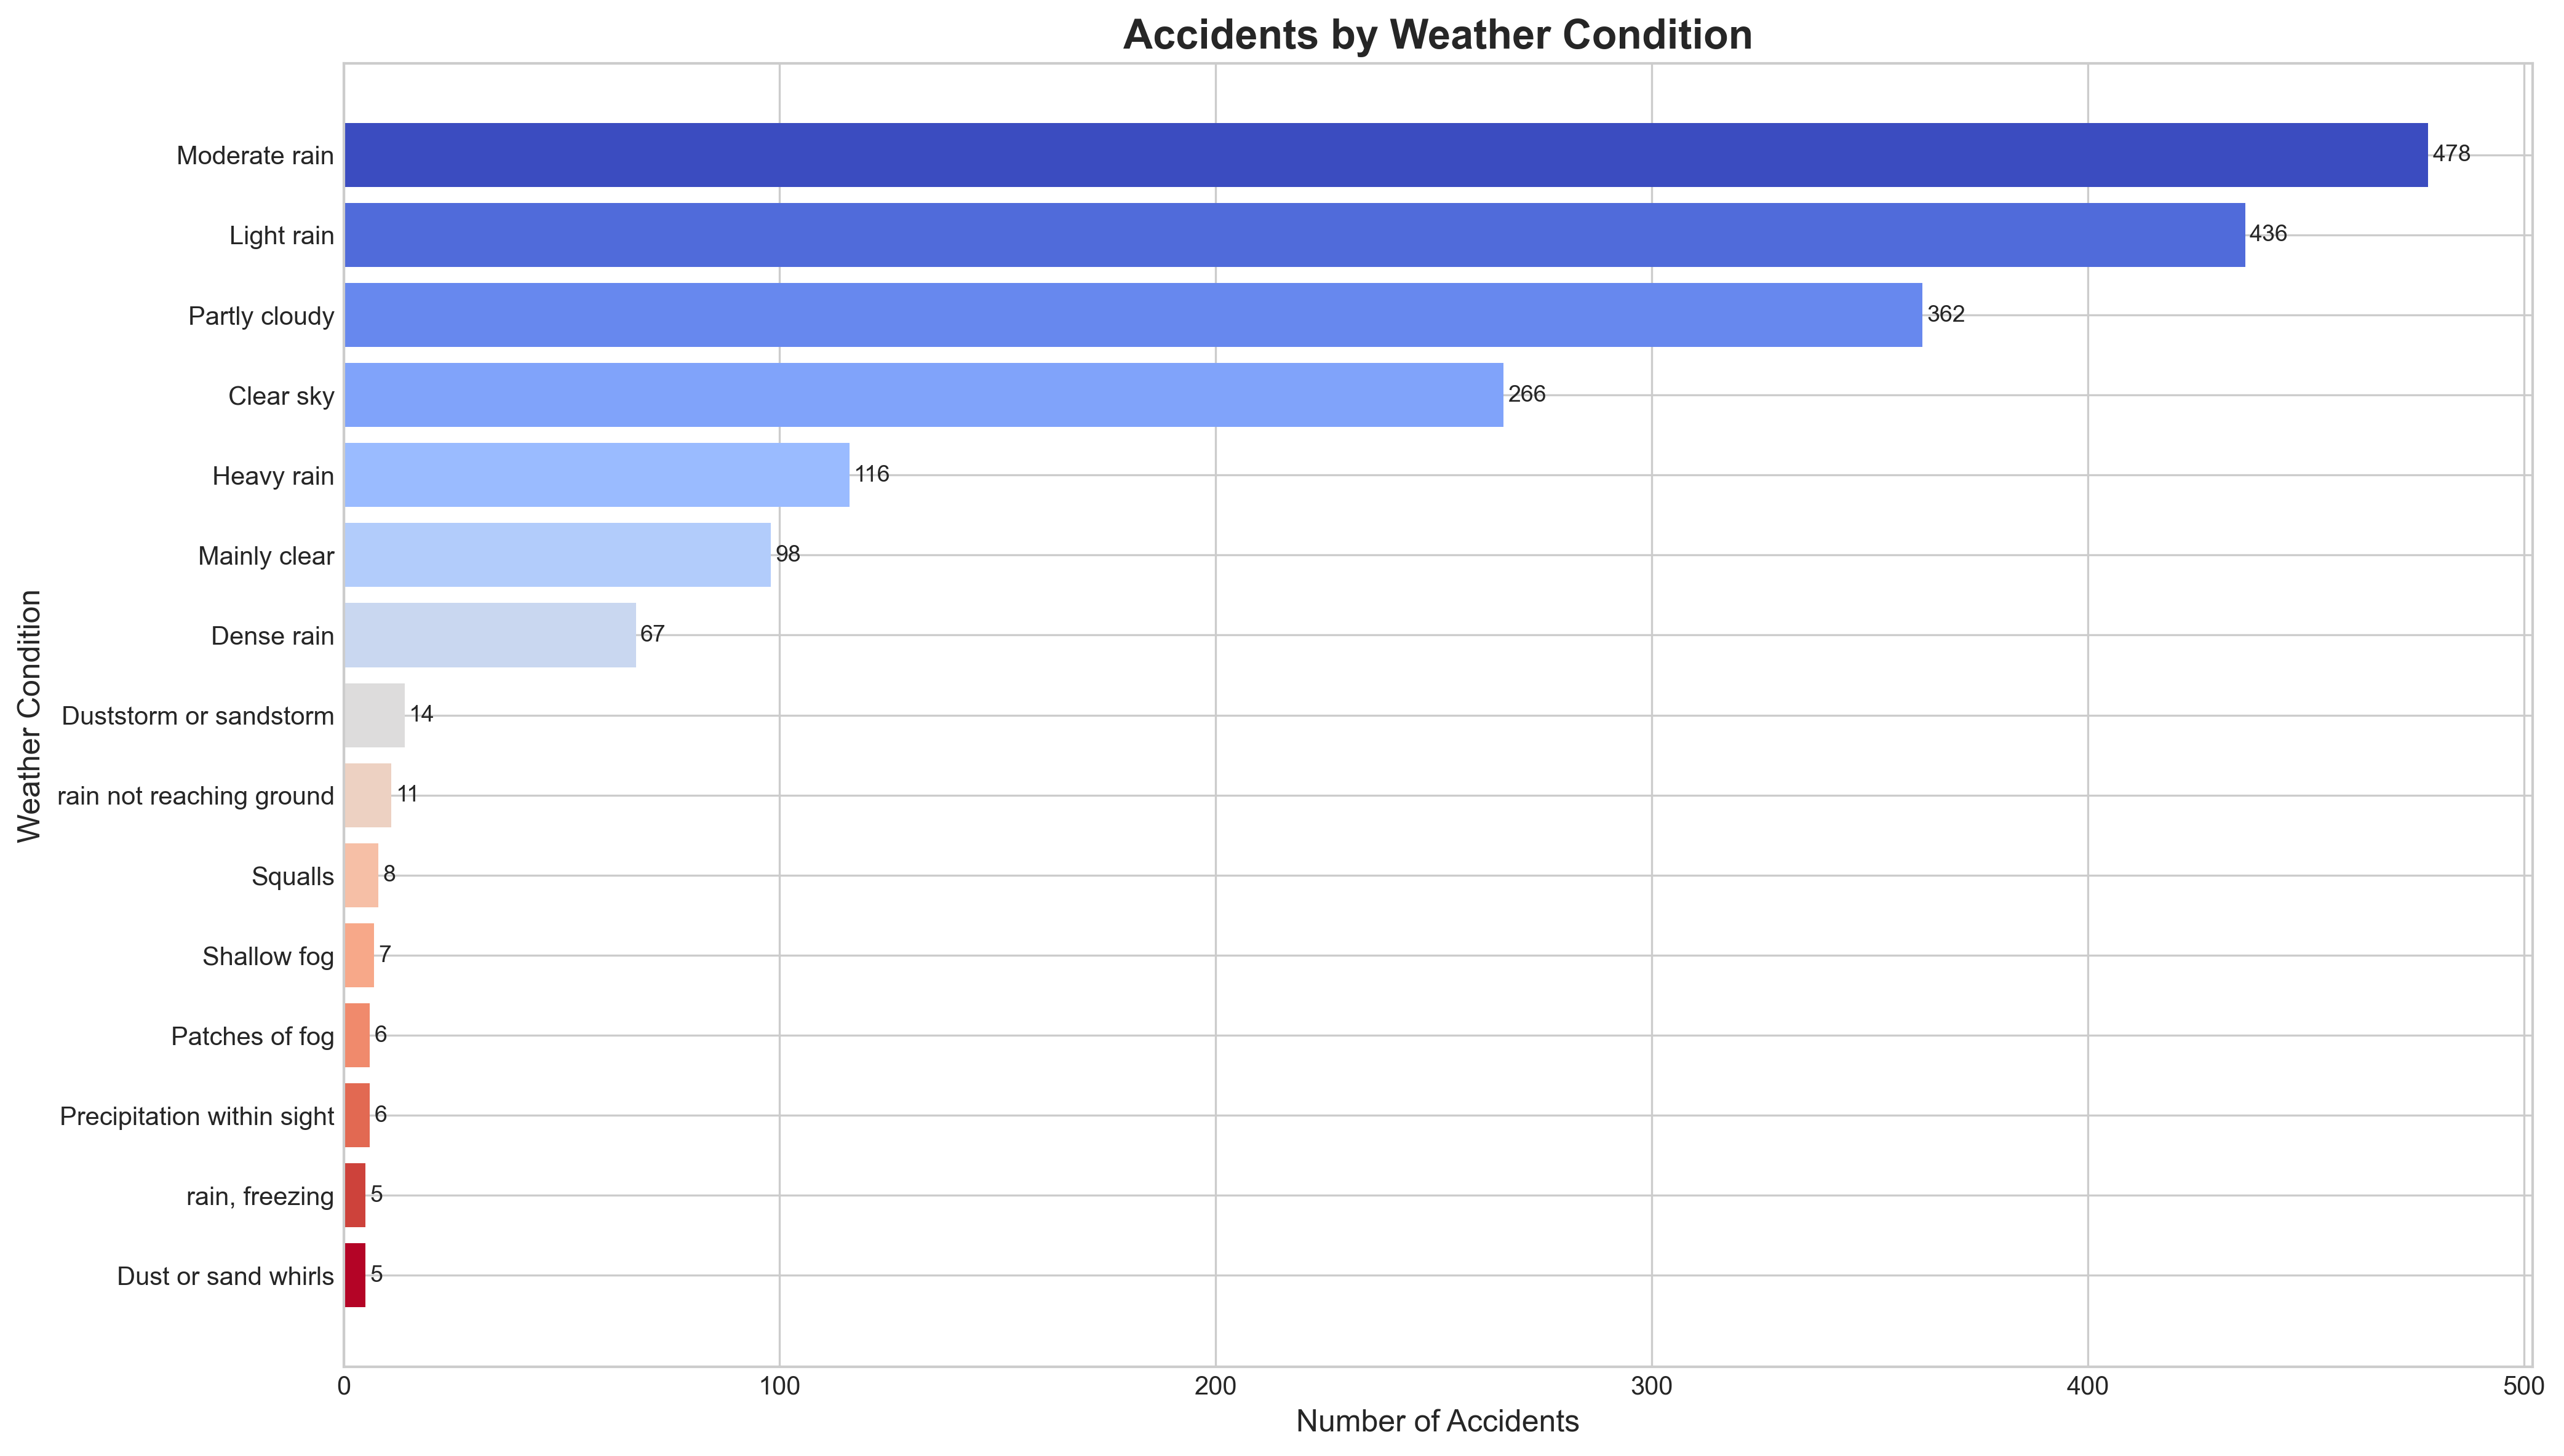
For Researchers: The model shows that weather and time-of-day play smaller roles than expected. Future studies should collect data on speed limits, road types, and driver demographics to improve predictions.
Limitations: This model cannot predict individual accidents - it identifies patterns across thousands of cases. Use it for strategic planning, not real-time decision-making.